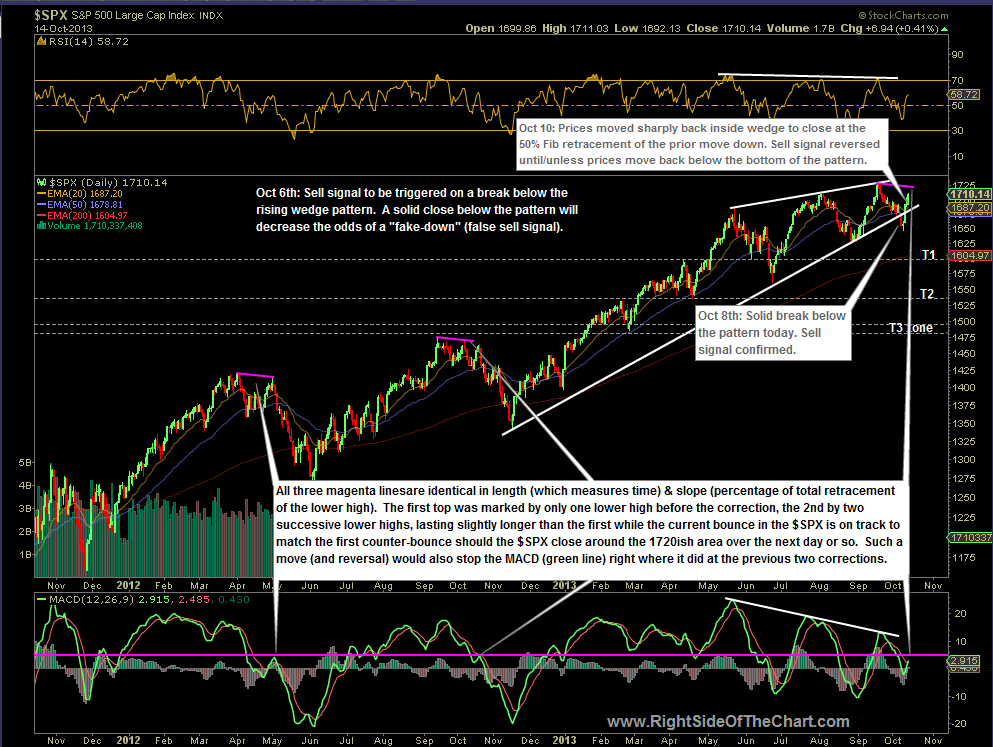
I’ve updated the $SPX live daily chart to illustrate just how far and long an initial counter-trend bounce can go once the market has peaked and a correction has begun. Over the last week or so, I’ve highlighted some potential resistance levels and Fibonacci retracements which often cap counter-trend bounces, all of which prices have moved beyond so far. While I am somewhat surprised at the resiliency of the US stock market over the last few trading sessions, the scope and duration of this bounce is still well within the norm for an initial counter-trend bounce, assuming that my read on the charts is correct (which the next few weeks will likely tell us if so).
This chart is a static screenshot of the new live $SPX daily chart. I drew a magenta colored trendline from the April 2, 2012 peak in the $SPX to the subsequent lower reaction high that was put in about a month later on May 1, 2012. I then made two identical copies of that trend line which I placed starting at the Sept 14, 2012 peak highs and the recent Sept 19th, 2013 peak high. As copies, all three magenta lines are identical in length (which measures time) & slope (percentage of total retracement of the lower high). The first top back in April 2012 was marked by only one lower high before the most impulsive phase of the correction began. The Sept 2012 peak was followed by two successive lower highs, lasting slightly longer than the first, before the sharp selling kicked in. The current bounce in the $SPX is on track to match the first counter-bounce should the $SPX close around the 1720ish area over the next day or so. Note how at this point, the $SPX is still shy of where it was on those previous two correction in both time and scope (retracement from the initial drop off the peak). Such a move (and reversal) would also stop the MACD (green line) right where it did at the previous two corrections.
I am not implying nor do I expect this correction (again, assuming that I am correct) to play out exactly as those previous corrections did. Maybe the next leg down starts today, maybe tomorrow, or maybe the next big move is to the upside on the way to new highs and then some. I wanted to impress that as “convincing” as the rally over the last several trading sessions has been, we are still well within the norm of where initial counter-trend bounces of substantial market corrections typically terminate, just before the most impulsive selling begins. Bottom line is that it may be best to keep things light for now until we get a better handle on which way this market is likely to head from here. My preference remains to see prices move back below the $SPX rising wedge pattern before adding any more short exposure or waiting until $SPX has clearly taken out the previous highs and unwound or negated most, if not all, of the divergences & other warning signs that continue to persist at this time before moving towards a net-long positioning.


