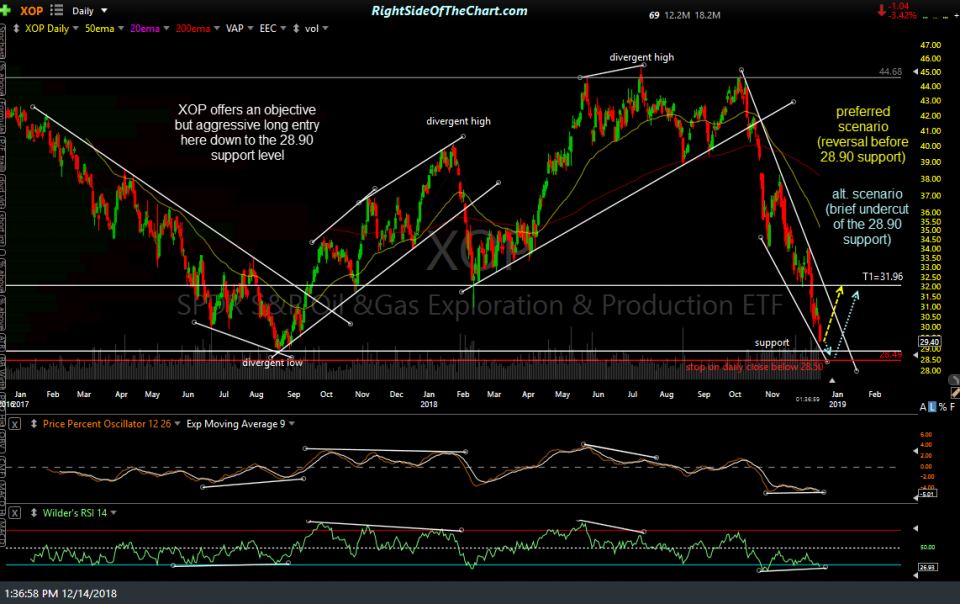
XOP (Oil & Gas Exploration & Production ETF) will be added as an Active Long Trade here around the 29.40 level with an optimal entry range down to but not below the 28.90 support level. While going long XOP here while clearly entrenched in a vicious downtrend should certainly be considered an aggressive, counter-trend “catch a falling knife” trade, it does appear to me that the R/R is favorable to begin scaling into a position at this time as my expectation is waiting for a decent buy signal will most likely entail missing out on the first 5% or so rally in the E&P sector.
The daily chart above outlines my primary scenario (yellow), which has the ETF reversing just shy of the 28.90 support with an alternative scenario, which is almost as likely, of a brief thrust down below that level before a tradable bottom is put in.
As I am viewing this as a counter-trend, bear market rally trade at this time, the sole price target is 31.96. The suggest stop for this trade is a daily close below 28.50, which will hopefully allow for an intraday selling climax that might briefly take XOP below support with a close back above it. Risk adverse traders or those expecting a much larger drop in the broad market might consider passing if this trade does not align with your risk tolerance, trading style or outlook on the broad market & energy sector.
The suggested beta-adjusted position size for this trade is 0.90 and again, one might opt to scale in vs. taking a full position at this time. If scaling in or holding off for a higher-probability entry on either a buy signal or tag of the 28.90 support, one might adjust their stop loss according to using a favorable R/R of 3:1 or better, depending on their average cost basis for the trade.


