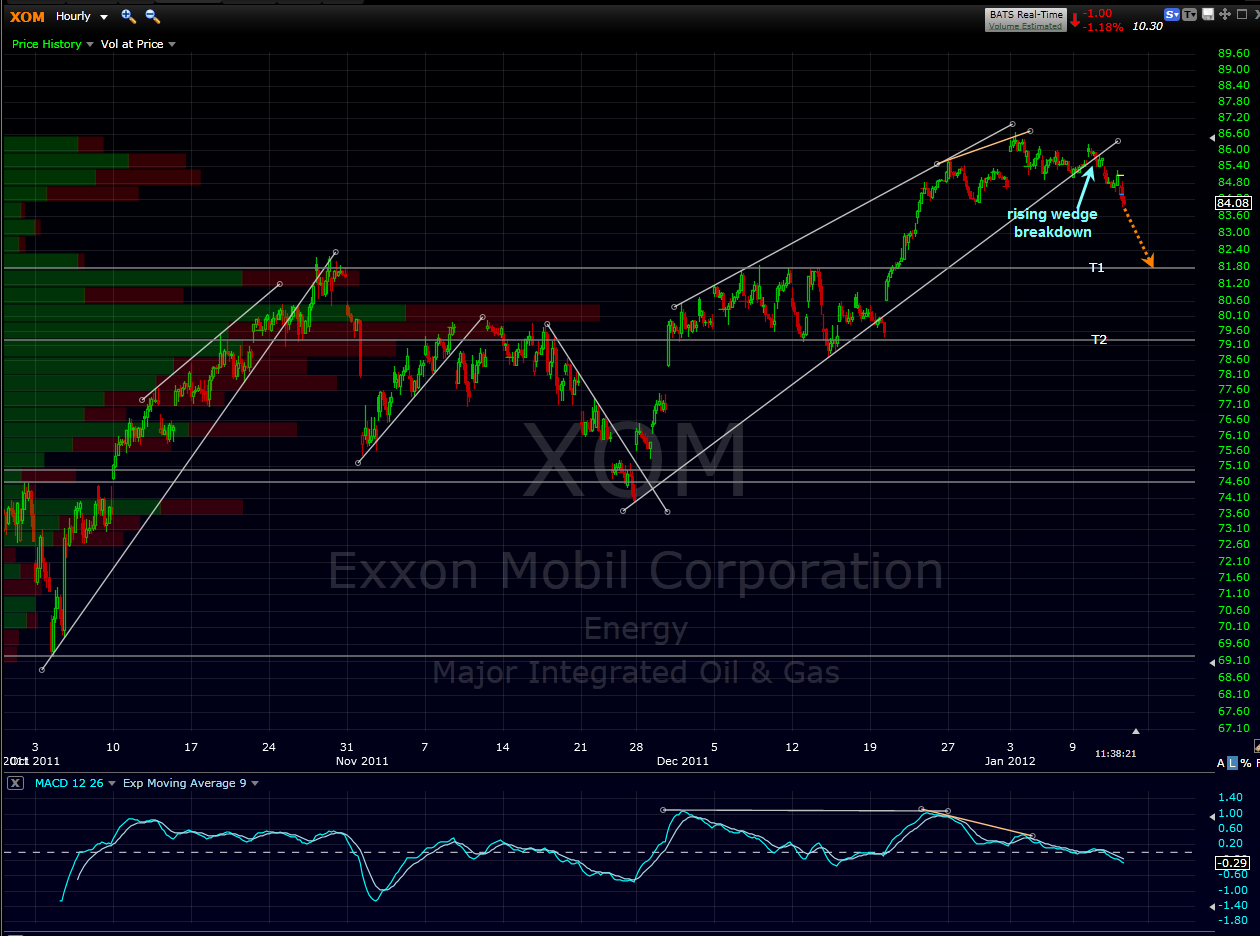
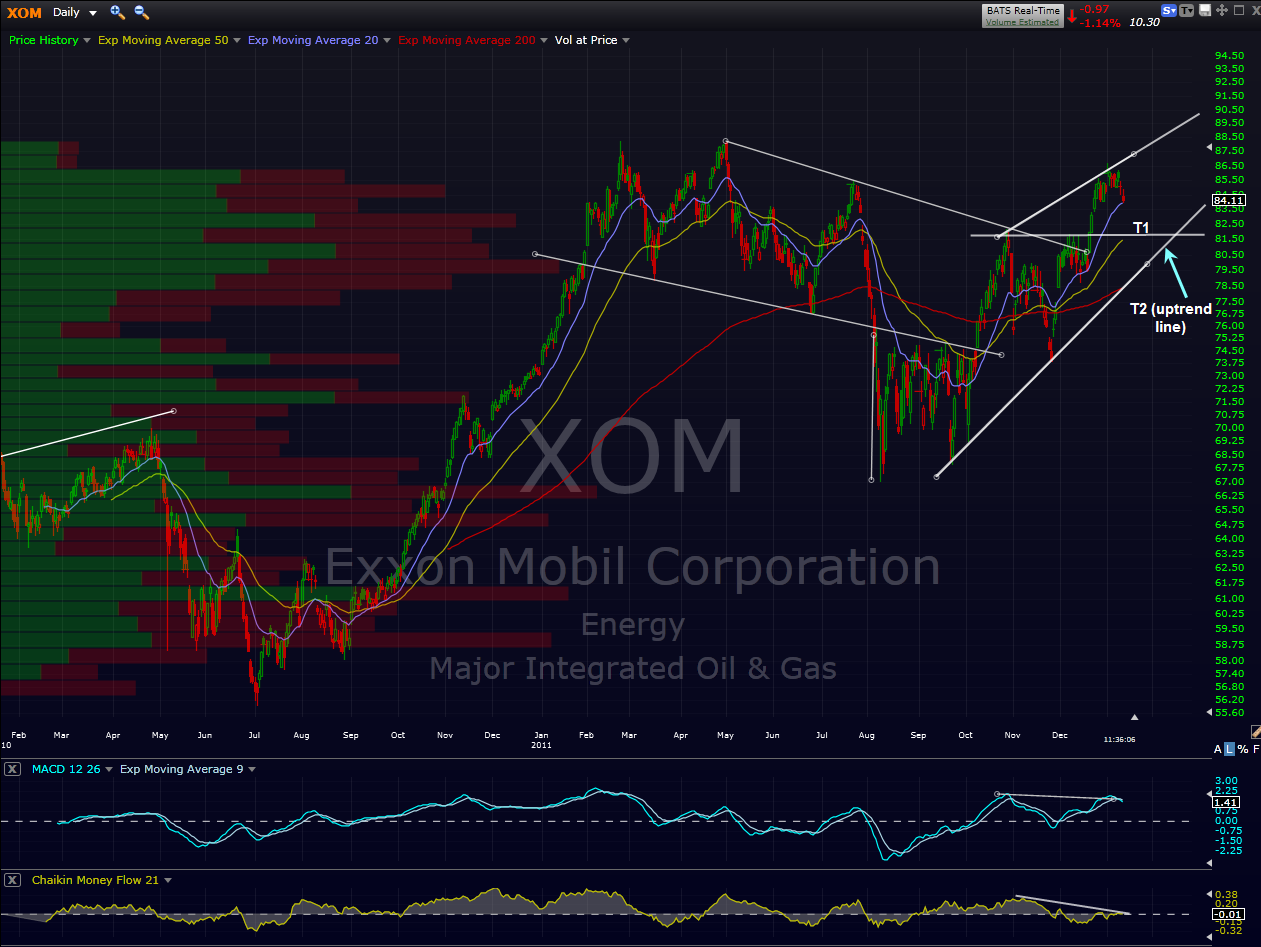
mentioned yesterday that the XOM 60 min rising wedge i posted last week had broken down (triggered). here’s the updated 60 min chart (with the original targets) plus the daily chart showing targets for anyone preferring to trade the larger time-frames. keep in mind that XOM is not only the largest energy stock, it is also the largest component of the S&P500 (i.e., “the market”). you typically don’t get a rising stock market when XOM is moving lower. take it fwiw.
Results for {phrase} ({results_count} of {results_count_total})
Displaying {results_count} results of {results_count_total}


