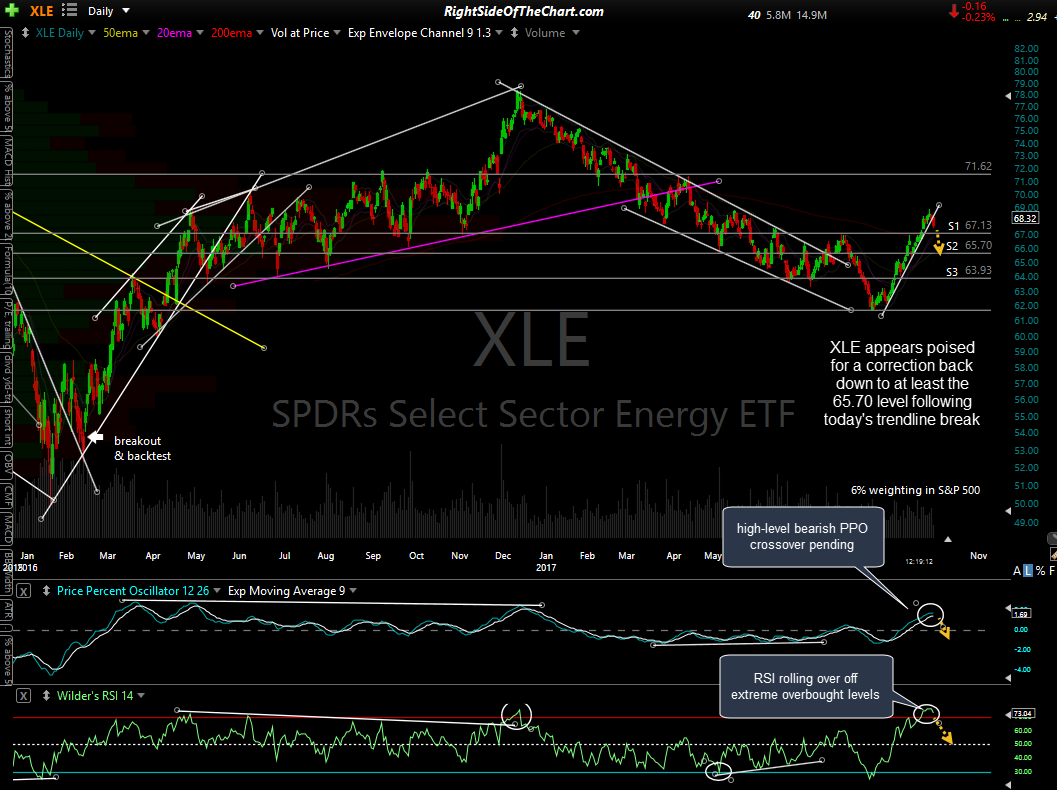
XLE appears poised for a correction back down to at least the 65.70 level following today’s trendline break. On the daily chart below XLE is coming off extreme overbought readings as the RSI begins to rollover. The PPO is also rolling over, currently poised to make a high-level bearish crossover. While the 13/33-ema trend indicator (histogram) is close to flipping from bullish to bearish for the first time since August.
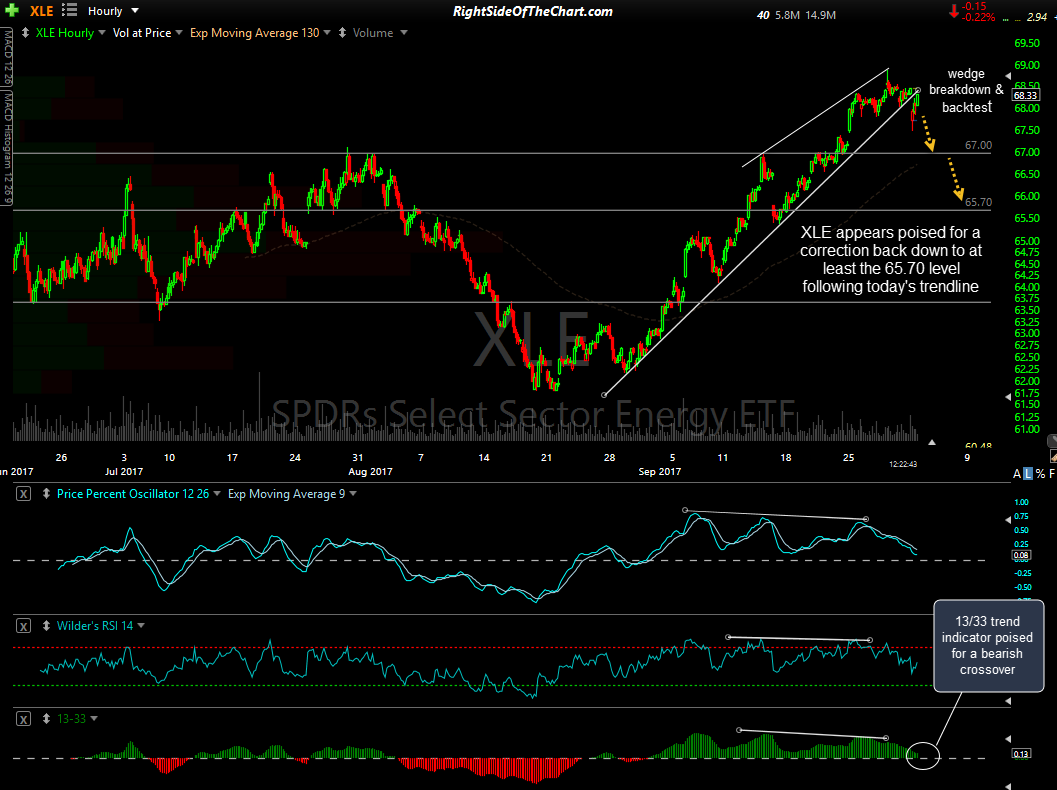
Although not an official trade idea at this time, for those interested in shorting XLE or any other energy ETFs, looking at the 60-minute chart below XLE is close to backtesting the trendline from below & appears to offer an objective entry here or on any additional backtest over the next day or so. Also note that the 13/33-ema trend indicator (histogram) is close to flipping from bullish to bearish for the first time since August. Typically, the trend is bullish when the 13-ema is trading above the 33-ema & bearish when below.


