
Member @zyx asked for my opinion on the biotech sector ETFs, XBI & LABD (3x short). As LABD & LABU (3x bullish) both track the same biotech index as the non-leveraged XBI, I prefer to use the charts of XBI for my technical analysis even if trading LABD/U as they suffer from decay due to the 3x leverage coupled with the volatile nature of the biotech sector, which in turn, paints an inaccurate price history in regards to the application of technical analysis.
Starting with the longer-term outlook via this 10-year weekly chart of XBI, it appears that the biotechs are likely in the final stages of a consolidation period following the initial leg down after a major sell signal was triggered on the breakdown below the bearish rising wedge pattern back in early Oct 2018.
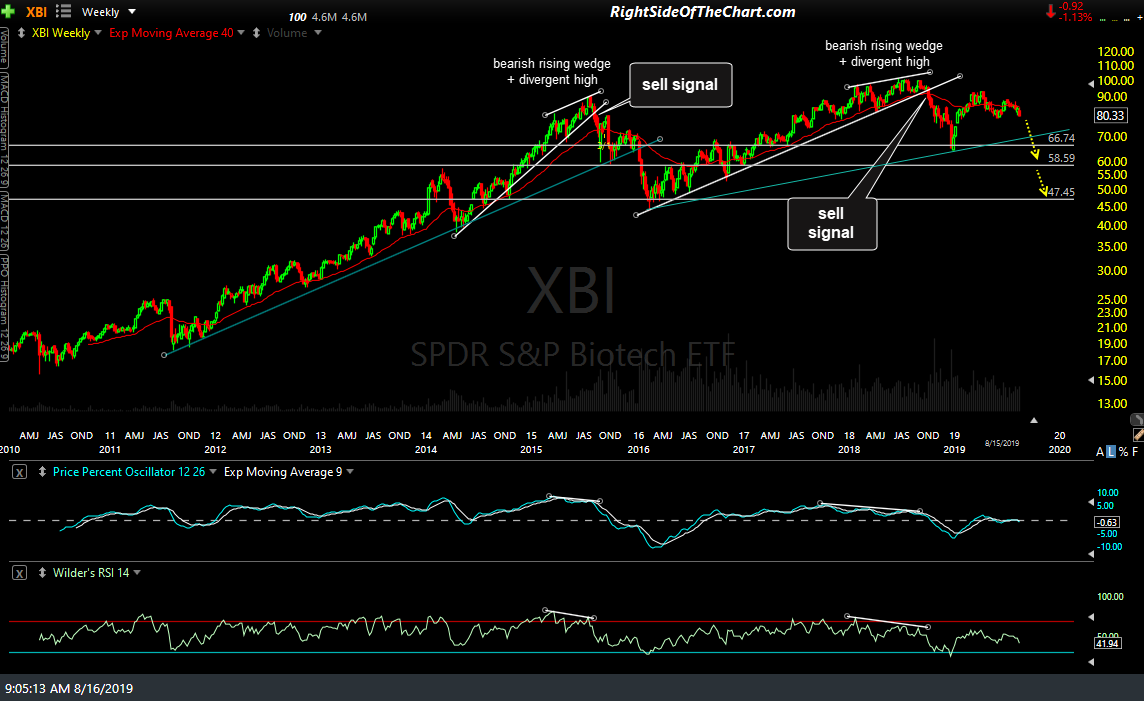
XBI weekly Aug 15th close
Zooming down to the daily chart, XBI closed just above the 80.19ish support yesterday with the next sell signal to come on a break below that level or any bounce back up to the 84.00 price resistance or downtrend line just above that offer objective shorting entries as well. Keep in mind, however, that until & unless the major stock indexes make an impulsive break below the August 5th lows (bearish) or above the SPY 294 & QQQ 191.50 resistance levels (bullish), most sectors will continue to grind around with fairly unpredictable & sharp rips and dips until the market decides the direction of the trend.

XBI daily Aug 15th close
Should XBI rally up to that downtrend line with the broad market rallying or at least looking potentially bullish as that time, my near to intermediate-term outlook might change to where I might consider a long entry on a breakout above the downtrend line. However, as if now, I favor the bearish scenario although XBI is still holding above that 80.19 support with the broad market also holding above the key August 5th lows for now. (translation: Probably best to hold off on initiating any new positions in XBI, long or short, at this time).