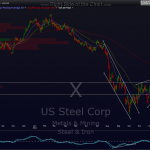
here’s a 120 min chart for the active X short trade. i show 3 nearby support levels (T1–T3) which X needs to hold or it will likely see the selling start to accelerate. if already short from the daily wedge breakdown, then consider waiting until S3 support breaks before adding (which is also a good entry if you are not yet short but like the pattern. personally, i would hold off on opening a new position until then). I’ve also included the original plus an updated daily chart below.
Results for {phrase} ({results_count} of {results_count_total})
Displaying {results_count} results of {results_count_total}


