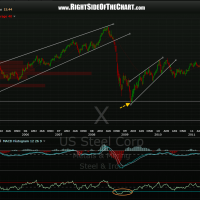
i went ahead and added the targets to the X Long-Term Trades idea that was posted on june 19th. i also removed the previously stopped out X active trade that was based off the 60 minute charts recently. that trade had hit it’s first target, pulled back to slightly below the suggested stop level (entry), and then ran up to T2 before falling back sharply.
this Long-Term trade, although posted while the 60 minute trade was still active, was a different trade with separate targets and stop criteria (a weekly close below the multi-year support line). since that last post, X made a second successful test of that weekly support line and has rallied of that level. i also want to point out the fact that some of the trades posted in the Long-Term Trades idea category will often overlap trades of the same stock or etf that are based on shorter time frames. as a trader or investor, make sure to use stops and profit targets that are inline with your time frame and trading style. although a long-term swing trader or investor might use the 60 minute chart to hone down their entry prices when scaling into a position, stops and profit targets for that trade will usually be based of the daily or weekly time frames. original and updated X weekly charts below. i also added a 2-day period chart showing some near-term targets as well.


