
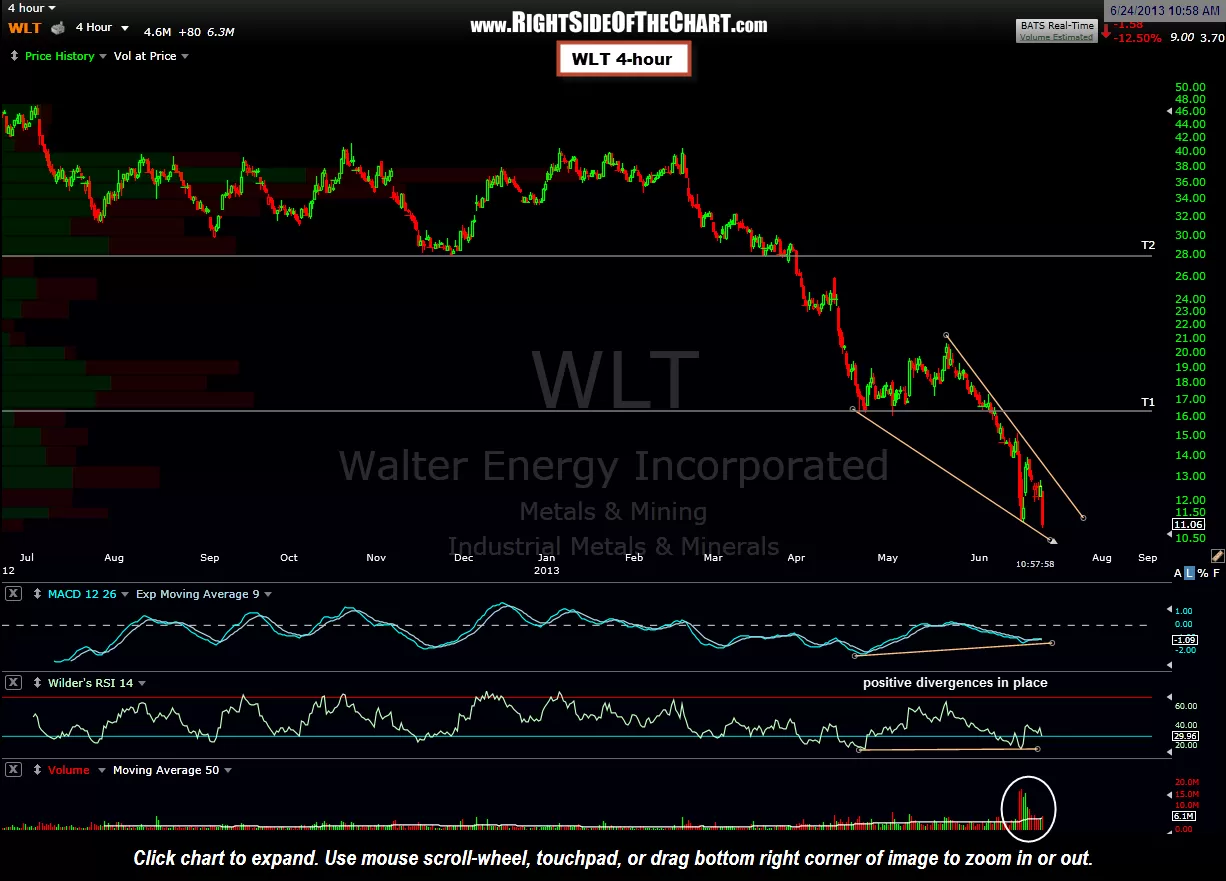
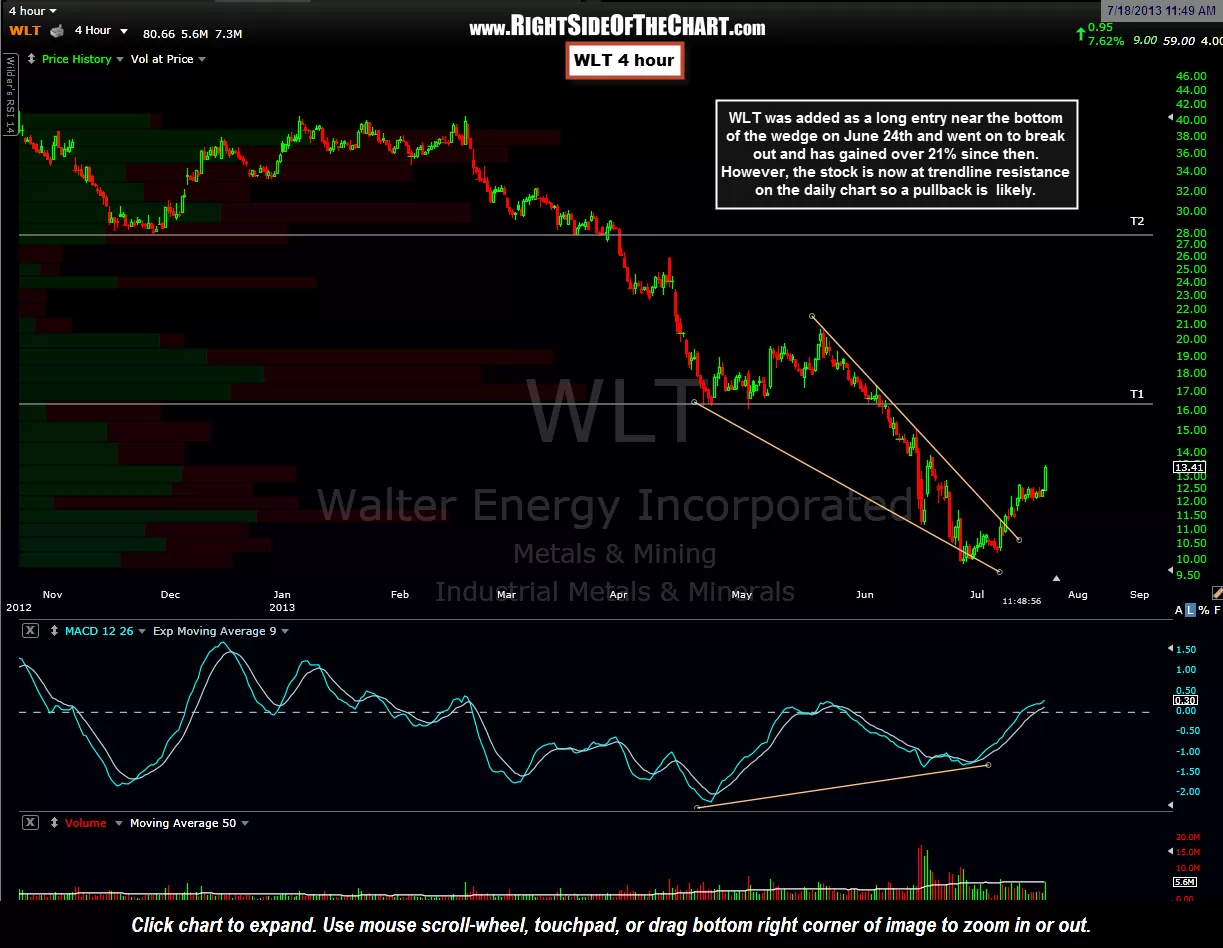
WLT was added as both an active long trade & long-term trade on June 24th while trading at 11.06. Both trades were based off a combination of the stock falling to support on the weekly chart with a bullish falling wedge pattern in place on the 4-hour chart (at the bottom of the pattern in anticipation of a breakout). As prices did break out of the wedge shortly thereafter and moved sharply higher, an update to the trade was made suggesting that more active traders book partial or full profits as the trade was up very sharply in short order while at resistance on the daily time frame. WLT did indeed pullback sharply shortly after that post and went on to make a higher low (a bullish event).
WLT is an example of the various trading styles that can be employed on many of the trades on the site. This trade was listed as both an Active Long Trade, which is the category for typical swing traders with an typical holding period measured in weeks and also as a Long-term Trade, which are trades with holding periods typically measured in months. The timely exit on WLT would have allowed more active swing traders to book the quick 21% gain and possible even recycle back into the position on the pullback. As stated at that time, the chart still looked longer-term bullish and as such, longer-term/less active traders might continue to hold the position.
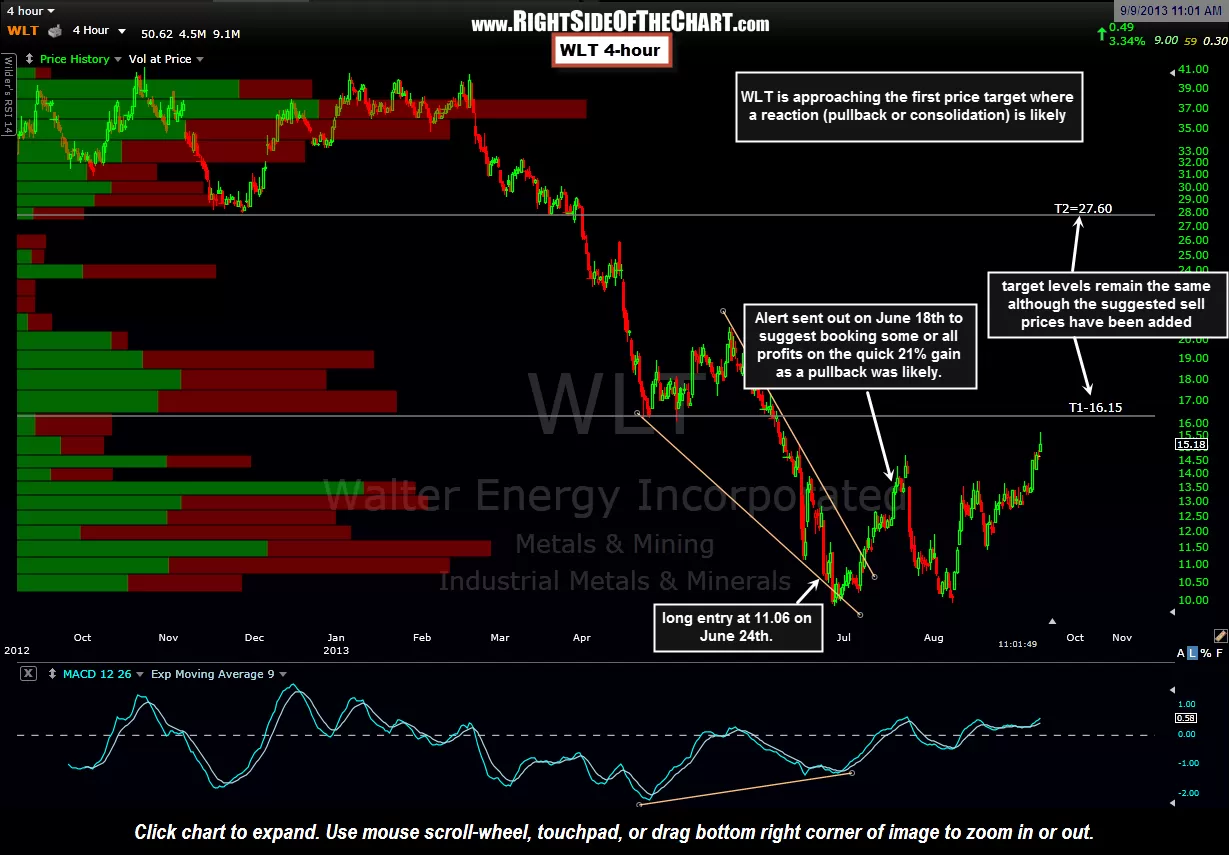
The previous & updated 4-hour charts are posted above with the most recent chart now listing the suggested profit taking levels (which are typically slightly below the actually resistance level in order to help minimize the chances of missing a fill, should the stock reverse just shy of resistance). If and when T1 (16.15) is hit, the odds of reaction (pullback or consolidation) are pretty good. I may decided to remove the trade if T1 is hit but for now, T2 remains the final target.