
WFC is trading at long-term support while at oversold readings that have historically preceded significant rallies in the stock in both bull and bear markets (green arrows). 10-year weekly chart:
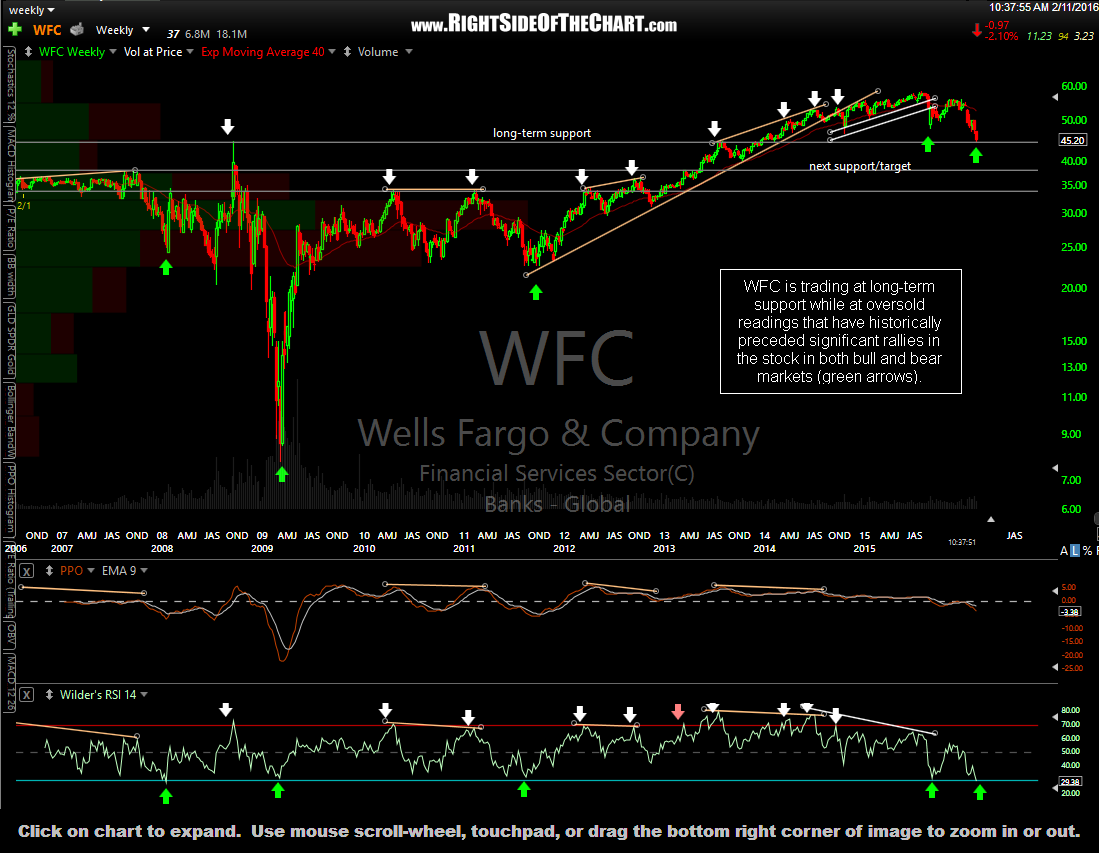
WFC weekly Feb 11th
On this 4-year, 2-day period chart, WFC testing key support with some potential positive divergences setting up on the daily chart. Just watching for now to see if this level holds (bullish) or breaks (bearish) although I wanted to share this chart for those interested as I might add WFC as an official trade idea, should the markets hold the S1 support levels & possibly if we get a quick break of that support & quick washout move to the S2 support levels (see the recent SPY & QQQ daily charts). I’d also like to confirm any potential long-side trade on WFC with confirmation via the financial sector (XLF). This current support level shown below is also long-term support (weekly chart above). This 2-day periods chart also shows the last trade posted on WFC with a very timely entry on the backtest of the rising wedge, covering at the open, just off the lows on that huge Aug 24th meltdown spike.
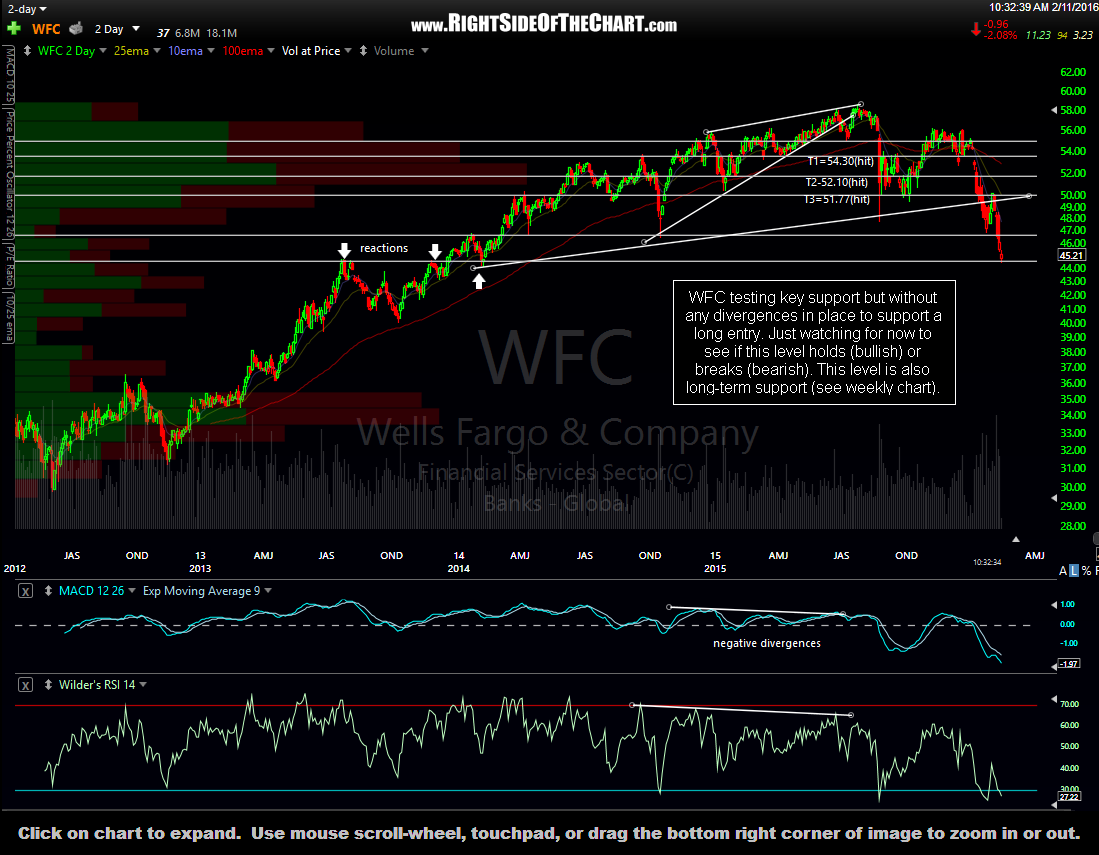
WFC 2-day Feb 11th