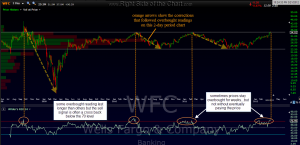
this is a 2-day period chart of WFC highlighting the stock’s performance following every instance of overbought readings (70+ on the RSI 14) in the last 4 years. keep in mind that when using a 2-day period, overbought readings on the RSI 14 are going to be a lot less common than on a daily chart. also see the BAC 2-day chart below, which show similar results. like BAC and XLF/SKF/FAZ, WFC can be considered a trade set-up or an active trade here as it is a very objective short right here at this key horizontal resistance line. with the current bullish momentum in the market right now, although it does appear to be waning, one might consider a strategy of scaling short into these individual banks stocks (or XLF/SKF,etc..) taking maybe a 1/4 to 1/2 position size this week and adding the remaining lots in the next week or two.
Results for {phrase} ({results_count} of {results_count_total})
Displaying {results_count} results of {results_count_total}


