
My commentary on gold & the mining sector has been light for a while now as there just haven’t been any new technical developments to discuss. Although time may prove me wrong, I’ve consistently maintained my view that gold likely put a double bottom in place with the December lows when prices hit my final downside target, the 12-year primary uptrend line as shown on the weekly chart. Nothing that I’ve seen on the charts since then has led me to change or even question my longer-term bullish outlook for gold & the mining sector. Yes, both gold and the mining stocks (which naturally follow gold prices) have been trading sideways for nearly two months now but that is perfectly normal, potentially longer-term bullish price action as gold & the miners are working off the overbought conditions from the very powerful mid-Dec to mid-March rally.
Again, I may be proved wrong on my longer-term outlook, especially if gold breaks below the primary uptrend line on the weekly chart as well as the December & June 2013 lows. Although the near-term technical picture for the mining stocks is unclear at this time, I am closely monitoring the daily chart of gold (first chart below) for a breakout above the downtrend line. Although the mid-March break above this trendline failed, as mentioned at the time, gold was extremely overbought and as such, the failed breakout & subsequent sell-off (as a result of the bull trap/failed breakout) did not come as much of a surprise. Since then, gold has consolidated sufficiently to work off the overbought conditions and as such, the next solid breakout above the daily downtrend line is likely to be the catalyst for the next leg higher in gold & the gold mining stocks. Any solid move above the March highs would be bullish for gold while any substantial move (lasting more than a few weeks) below the June & December lows would have longer-term bearish implications.
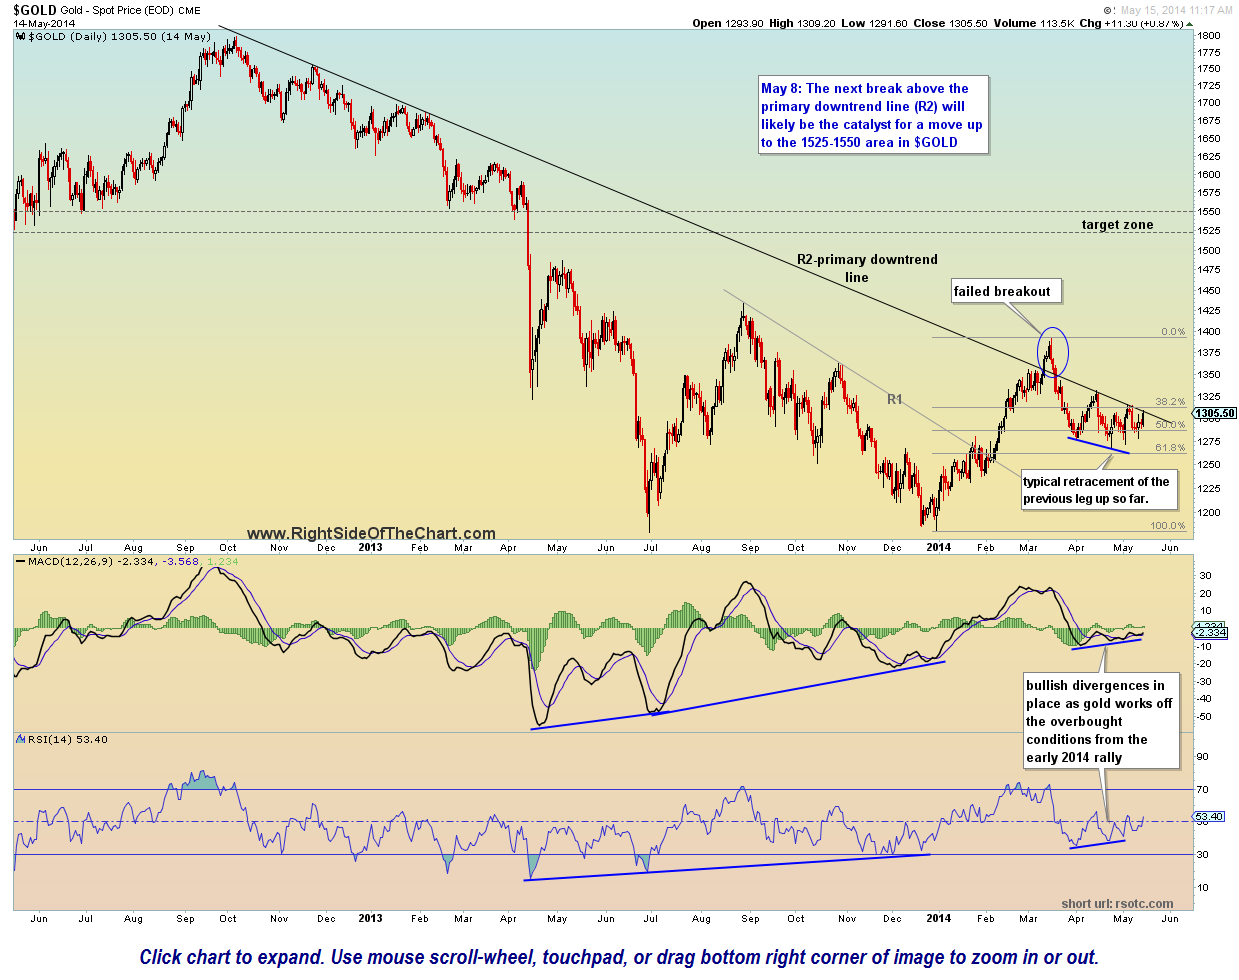
$GOLD daily May 15th

$GOLD weekly May 15th