As I had stated in this post last Wednesday, from the looks of the recent continued selling by the Foundation, it appears that the supply/demand equation may have reached an equilibrium point around the 5.00 level as the continued insider selling in recent sessions has been met with nearly an equal amount of buyers to soak up the supply. With VHI (Valhi Inc) now up 36% since hitting a multi-year low of 4.98 the day before that statement was made, as well as looking at the massive volume on the steep price advance since then, I believe that the odds are now very good that VHI has seen what will likely prove to be a lasting bottom in the stock.
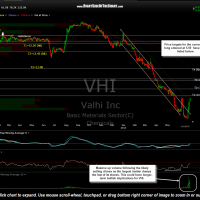
- VHI daily July 1st
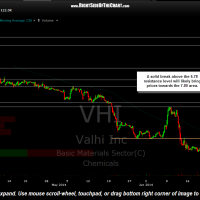
- VHI 60 minute July 1st
My bullish read on the stock not-withstanding, I want to continue to reiterate that this trade is a very aggressive attempt to catch a falling knife and not an ideal trading candidate for risk-adverse traders or investors. With that being said, I do plan to add this trade to the Long-Term Trades category as well as the Active Long Trades (which are typical swing trades), which VHI was most recently added back as a new trade when it took out the 5.50 resistance level last Wednesday shortly after that previous post. The most optimal entry for Longer-term Traders looking to position for a move up to the T3 or T4 levels (8.69 & 9.97) would be to use a scale-in method, adding the first lot on either a break above the 6.80 level or on any decent pullback from this support level (VHI is currently trading just below the 6.78 resistance level). Additional lots could be added on either weakness (but not below 5.50) or on a solid break above the 7.00 resistance level.
With VHI now just shy of the first resistance/target level shown on the previous 60 minute chart (6.98 actual resistance level), I wanted to share my thoughts and plans to change the price targets on the trade back to those posted on the daily time frame from the previous trade which was stopped out. With the first target (T1) on the daily chart being the same horizontal resistance level shown on the previous 60 minute chart (6.98), the suggested first target for this trade will be 6.95, which is a few cents below the actual resistance level, in order to help avoid missing a fill, should the stock reverse just shy of resistance. I’ve also updated the 60 minute chart to show a new resistance level at 6.78, which prices are current testing. A solid break above the 6.80ish level would likely open the door for a continued move up to the second target level (daily chart) of 7.72, which is the level at which I currently plan to book partial or full profits on the trade if VHI gets there in the near-future.
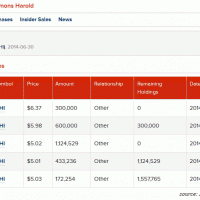
As supporting evidence for the longer-term bullish case which also meshes with my prior discussions about a likely selling climax in the stock, here are a few headlines stating that the Harold Simmons Foundation, which was by an extremely large margin, the largest shareholder, has now sold it’s last share of VHI following an aggressive multi-month selling spree which was undoubtedly the primary factor in the large drop in the stock this year.
http://tickerreport.com/banking-finance/240451/insider-selling-valhi-insider-unloads-600000-shares-of-stock-vhi/ (note: the remaining 300,000 shares mentioned in this article were sold yesterday, according to this report from Insider Monkey.)


