
VHI will trigger a long entry on any move above 1.27. T1 is 1.55 with a suggested stop on a 60-minute close below 1.18. The horizontal lines mark resistance levels which might be added as additional price targets. As the charts on VHI are constructive, indicating a possible lasting trend reversal, plus an above average dividend yield of approximately 6.8%, VHI will also be added as a Growth & Income Trade idea. As this is a low-priced stock in trading not far off all-time lows in a primary downtrend, it should be considered an aggressive trade with the appropriate beta-adjustment made to one’s position size, assuming that this trade even meshed with their objectives & risk tolerance to begin with. An alternative entry would be to wait for VHI to clear the 50-day ema, which has acted as resistance since mid-2015.
note: By the time I finished annotating & uploading the chart + composing the post, VHI triggered an entry & is trading at 1.28 as I type. Therefore, this is an Active Long Trade (i.e. Swing Trade) and Growth & Income Trade as this time.
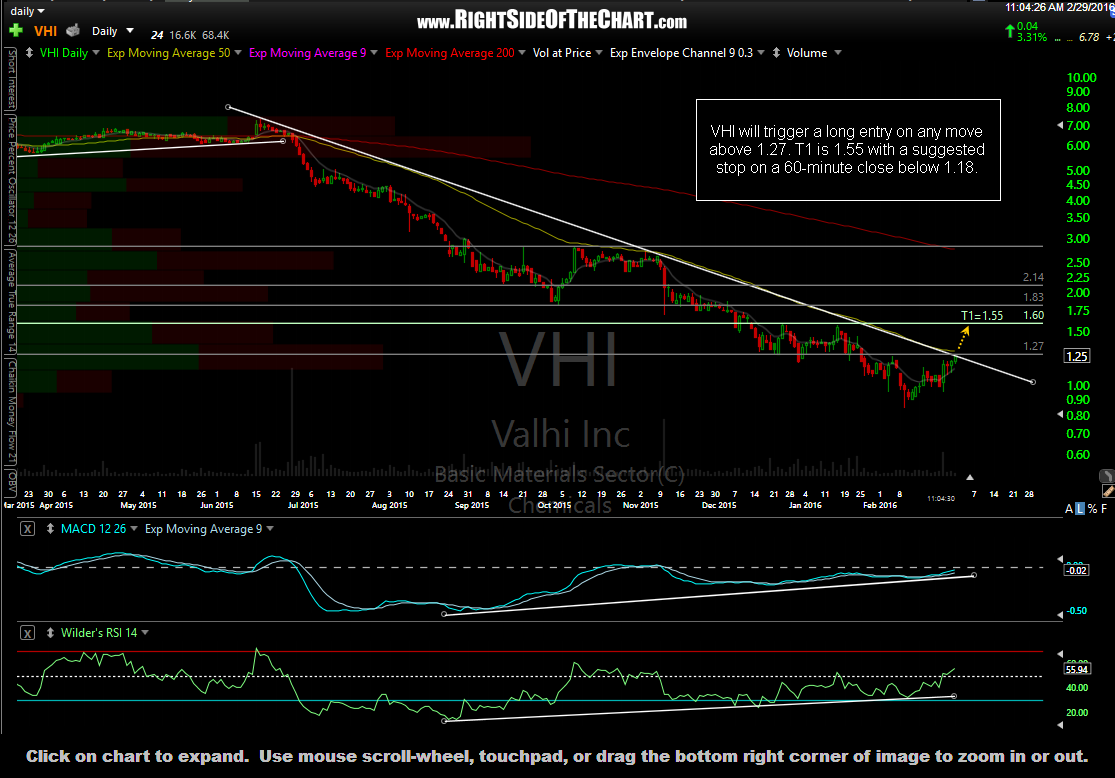
VHI daily Feb 29th