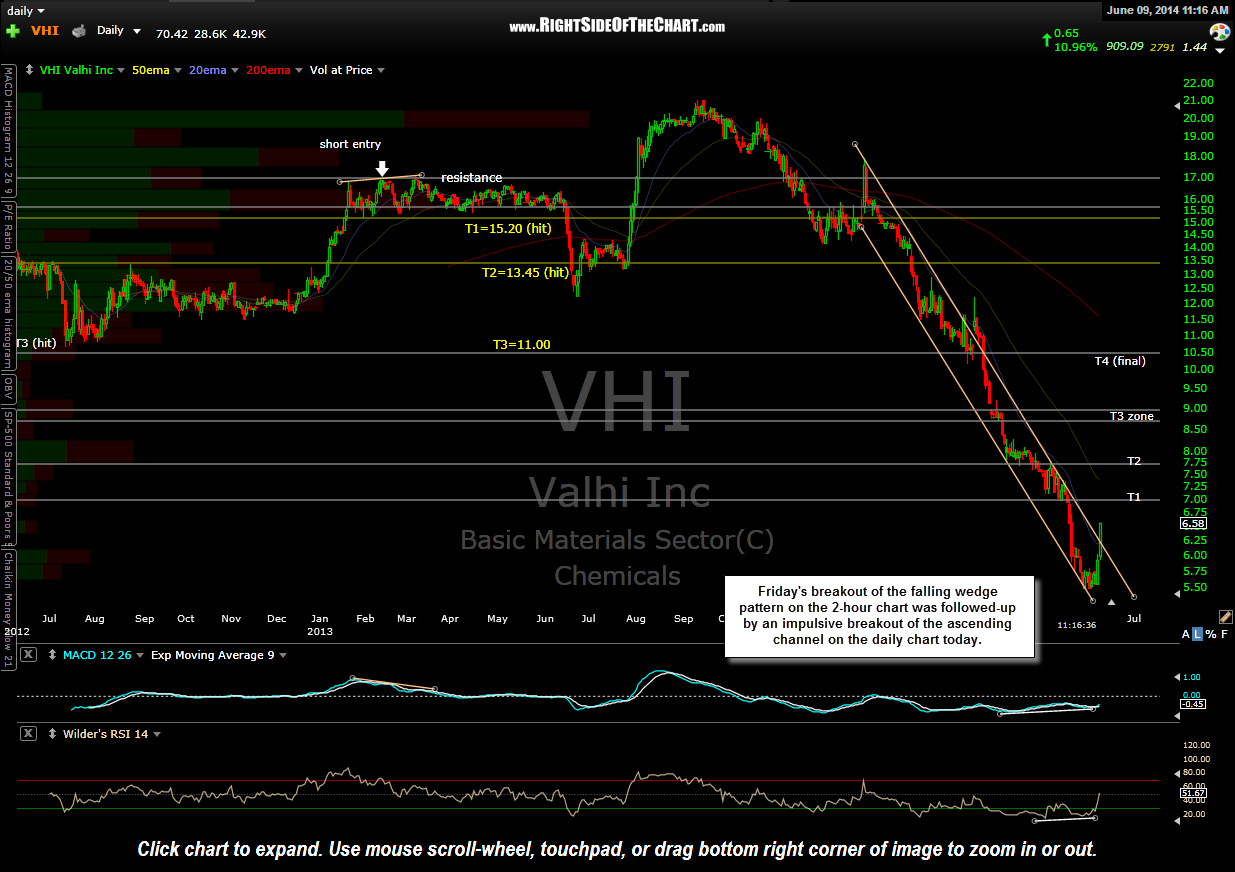
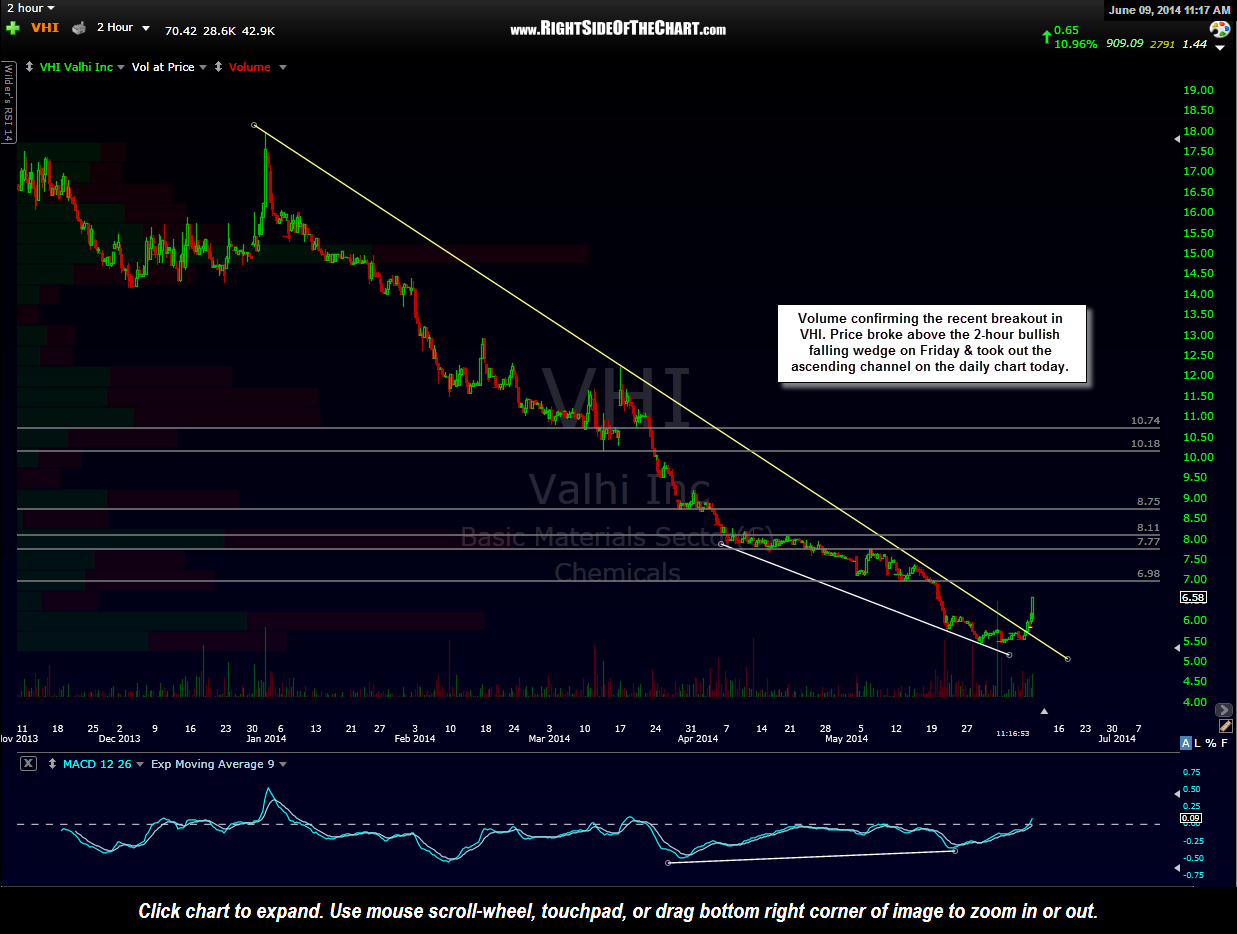
Following Friday’s breakout above the bullish falling wedge on the 120 minute time frame, VHI (Valhi Inc) continues to move sharply higher on above average volume, up 19% since Friday morning & breaking above the descending channel on the daily chart today. Although this trade is only back to the entry price on the original (aggressive) entry of the initial lot, with the addition of the second lot (at a lower price) following Friday’s breakout of the falling wedge pattern, VHI is now profitable on based on the average cost.
Normally I state my preferred target when multiple targets are listed but with this erratic, thinly traded stock which is still firmly entrenched in a longer-term downtrend despite the recent bullish price action, I’m going to have to play this one by ear but will do my best to update any significant developments asap. However, at this time, I’m more focused on the daily targets than those on the 120 minute chart. The recent price action in VHI could very well prove to be a fleeting snap-back rally/oversold bounce but with solid bullish divergences in place on the daily time frame on a well-established, diversified & deeply oversold company, VHI does have the potential for a more lucrative multi-week or month swing trade.
-

- VHI 2-hour June 9th
-
- VHI daily June 9th