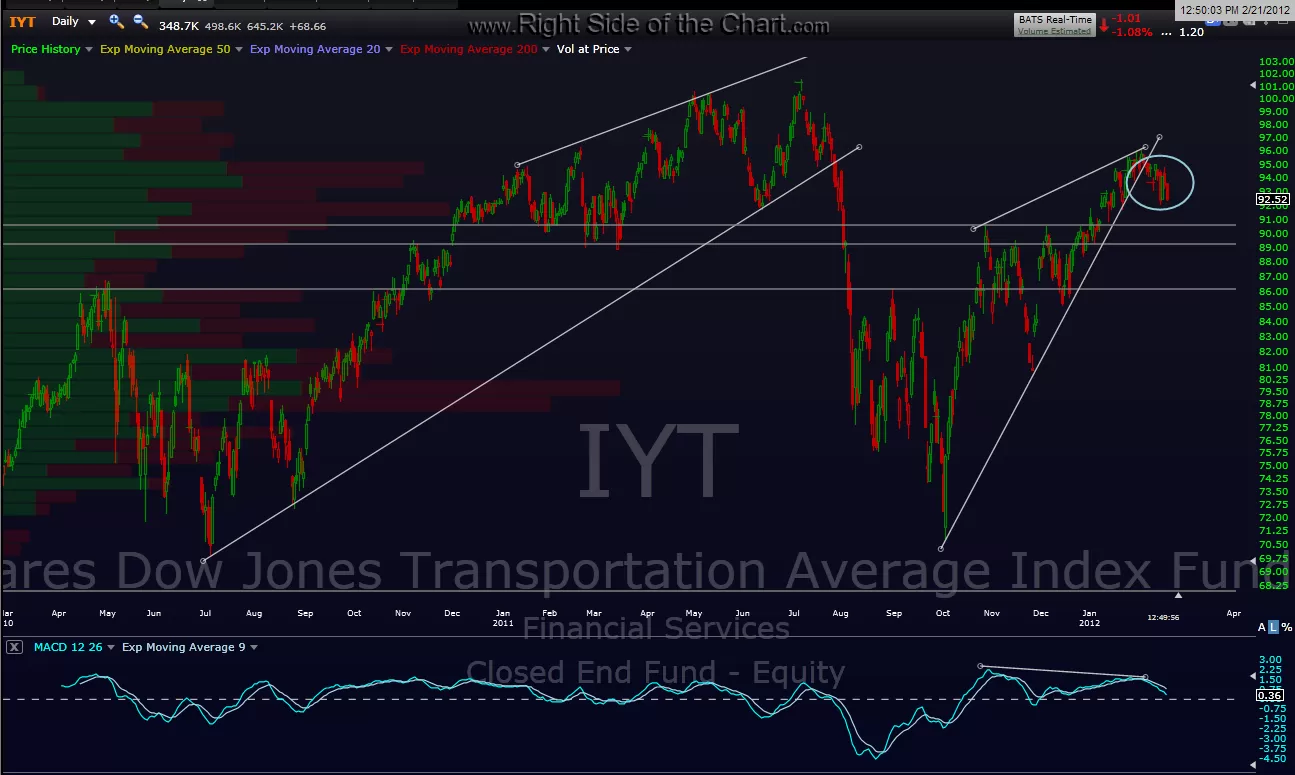
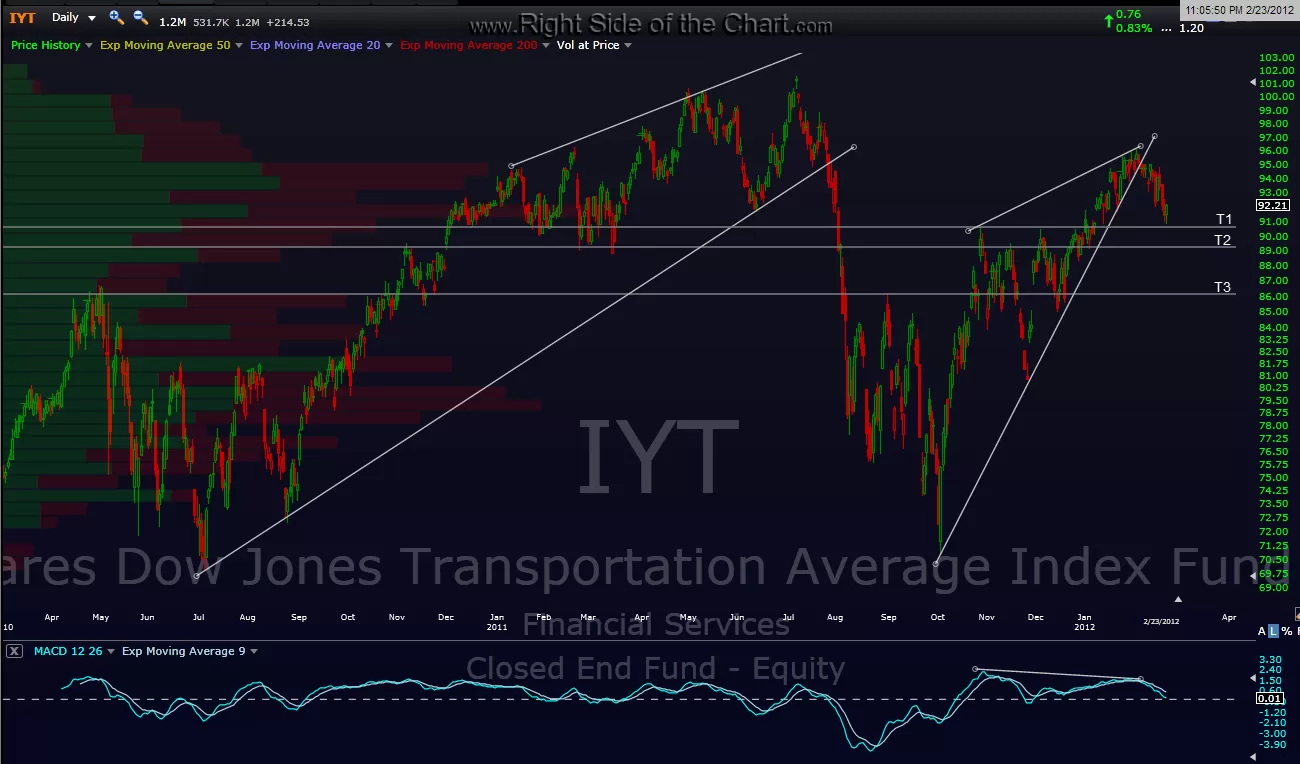
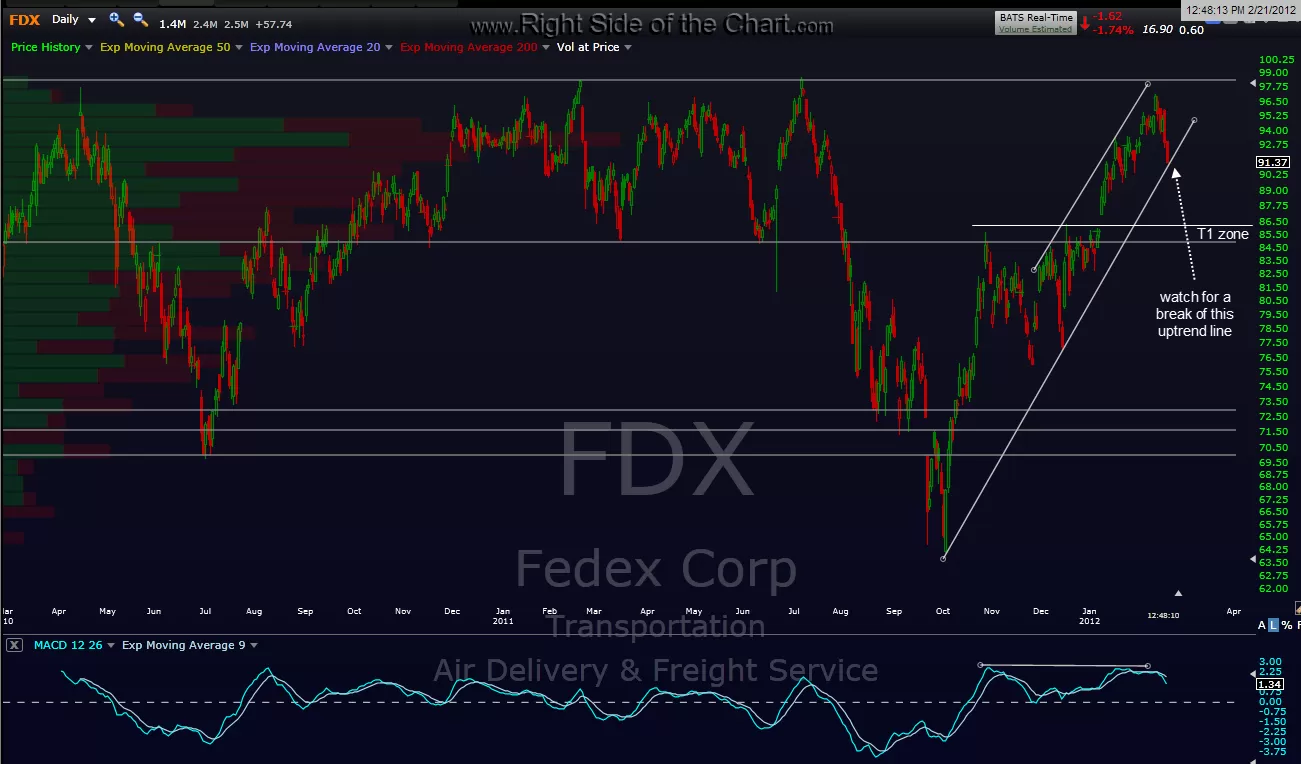
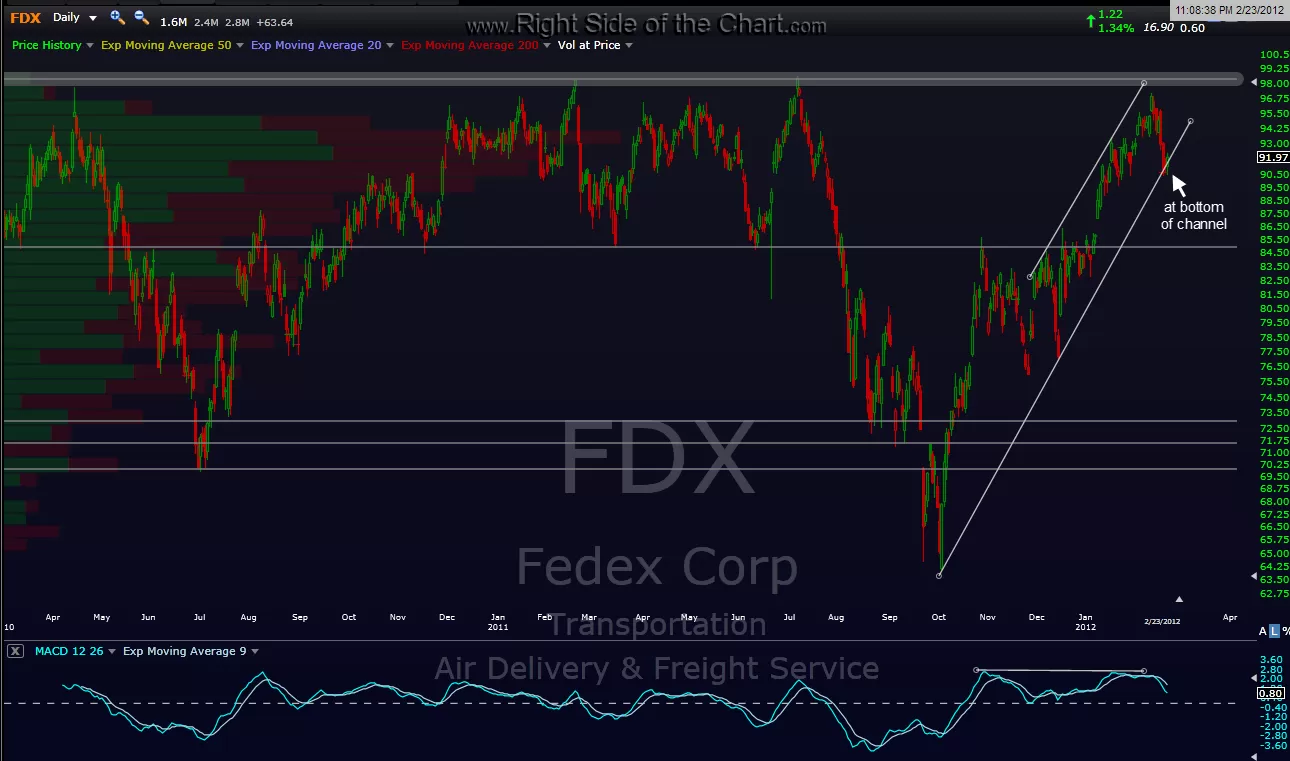
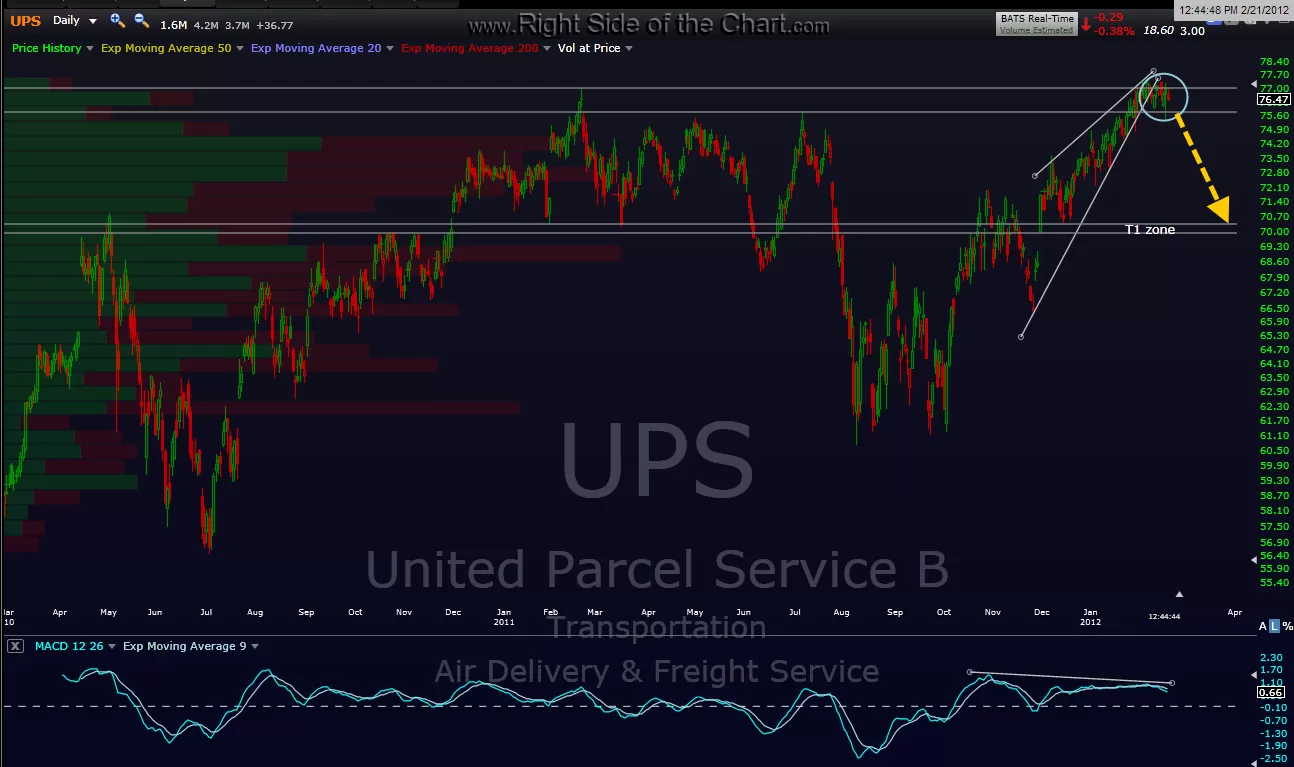
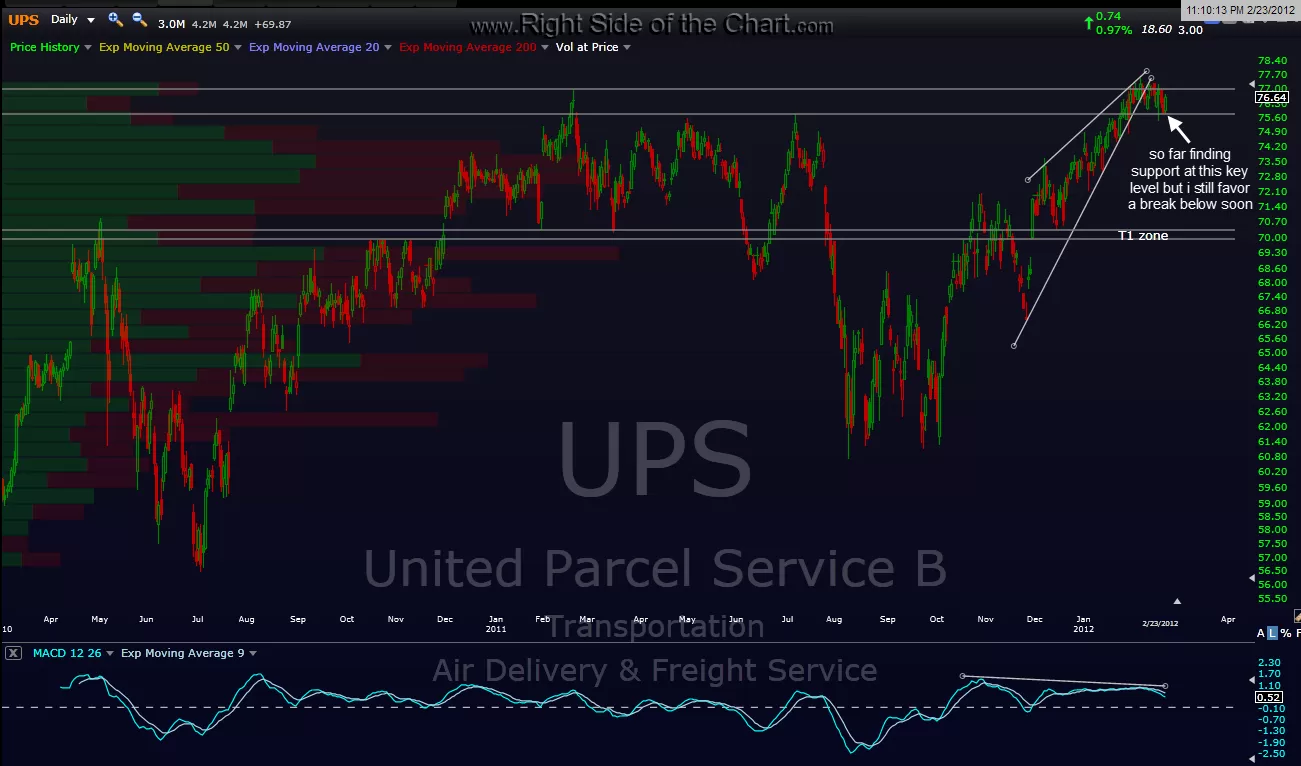
here are those updated charts on IYT (transports etf) as well as UPS and FDX, it’s 2nd and 3rd top-weighted holdings (last chart first, today’s updated charts 2nd on each symbol). as per the last post on these 3, all three have hit their first key support areas (FDX still finding support at the bottom of it’s uptrend channel). although these stocks can break either way here, and although with the un-relenting momentum of the broad markets, i am going to take the more difficult call of saying these stocks will likely break down from these support areas soon, before a meaningful bounce. again, this is just a call, i.e.- my best guess but support is support until broken. therefore, if you are not already short any of these names from my previous posts, or you own analysis, the only objective entry right now would be on the LONG side, as you want to buy support. however, a short selller wants to sell BROKEN support so would naturally wait for a confirmed breakdown of these key levels.
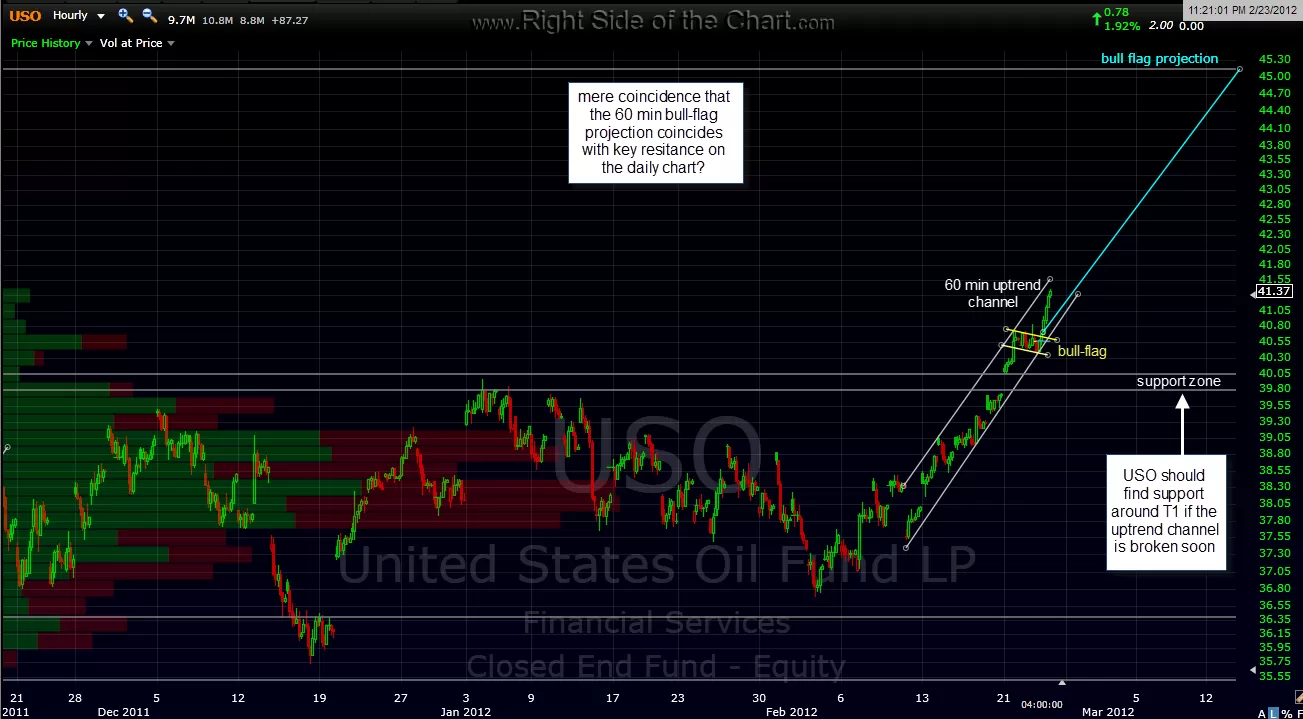
with that being said, here’s some pretty detailed charts on USO, which aims to track the price of west texas light, sweet crude oil. yes, i could do a chart of brent but for now, let’s keep things simple (although wait until you see this chart…it’s a bit busy). the notes on the charts are pretty self-explanatory but to summarize, USO has gone near-term parabolic on the 60 min chart. that means that the party can end at any moment and when it does, odds are that prices will drop, at least for a day or two, as quick or quicker than they went up. my point, don’t mess with this one if you are not comfortable with that. also, consider keeping position sizes on the light side if you do. as the chart notes, there is a very steep uptrend channel that has formed on the USO 60 min, which if broken, could lead to a pullback to the support zone marked on the chart. however, with both the EURO at a key resistance level (posted earlier) and the $USD at a key support level, IF those currencies break-out (down for the dollar) then I believe this 60 minute bull-flag that i highlighted here could play out. it’s actually a bit small in size and time for a bull-flag relative to the length of the pole and i don’t favor that happening, at least without a consolidation first, but it does have a chance of doing so if the current trends in the EUR and USD continue. note how well the measurement on that 60 minute bull-flag coincides with resistance on the daily chart.
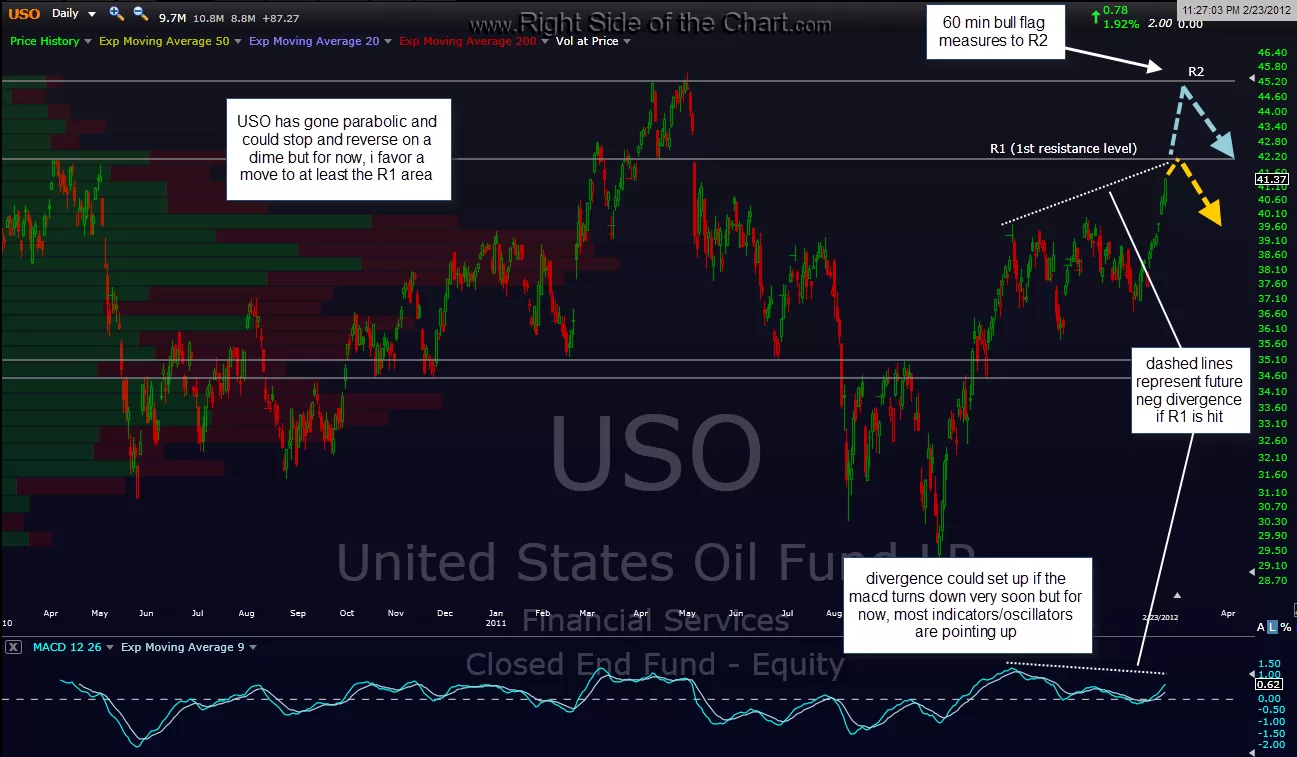
finally, on the USO daily chart, my favored scenario is a move to T1 and then a pullback. whether or not it is a shallow pullback/consolidation and then a push up to T2 is hard to say at this point. if so, then those transport stocks are going to take it on the chin, as is the broad market. again, my favored scenario is that USO stops and turns down off T1 but as i said on the 60 min, these parabolic moves can stop on a dime or they can keep going longer than most could imagine. therefore, if USO just pauses or blows right past T1, make sure to have your short-list ready for oil-sensitive stocks. likewise, if USO makes a solid reversal and break of the 60 min channel, than IYT, UPS, FDX and my the recent/current airline shorts should provide a nice, quick long-side bounce.