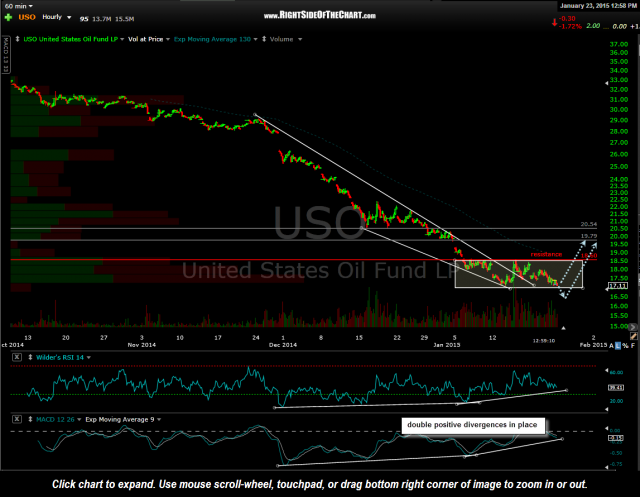
USO (crude oil ETF, along with UCO, the 2x long crude ETF) is current trading at the bottom of the recent trading range although we now have double positive divergence (back to back bullish divergences) on the 60 minute time frame. Those divergences would still remain intact should USO make a relatively brief & shallow break below the recent trading zone. In fact, at this point I would almost expect a brief breakdown which could serve as a bear-trap & flush-out move.
As the UCO trade is taking longer to play out than expected with crude trading sideways in this highlighted consolidation zone since Jan 6th, my focus going forward will be on the USO (1x crude ETF) chart, which does a better job of tracking crude prices over time as prices are not prone to the same decay as the leveraged ETFs.
The most likely scenarios are illustrated in this updated 60 minute USO chart; either a move higher from around the bottom of the zone or a temporary break below before prices reverse. Any move much below the 16.00 level would most likely open the door to a new wave of selling.
Just to clarify, I still only favor a short-term swing trade on crude at this time with a slight possibility of a longer-term bottom. I just don’t see enough technical evidence on the daily & weekly time frames to make a solid case for a lasting bottom yet. My ideal longer-term scenario would be to get the decent counter-trend bounce that I am looking for (19.80-20.55ish in USO), followed by a thrust down to a new lower low, while forming higher highs on most of the price & momentum indicators (i.e. – a divergent low on the daily chart).
With that being said, recent volume patterns in USO look highly capitulatory and a lasting bottom in crude may possibly be close at hand. As for a longer-term swing trade in crude oil and/or the energy stocks, we’ll just have to continue to monitor the charts for any bullish developments.


