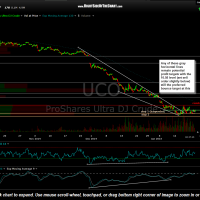
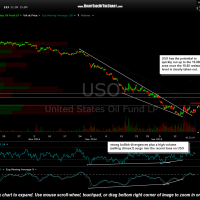
These are the latest 60 minute charts on both UCO (2x long crude oil ETF) and USO (1x long crude oil ETF). Based on my analysis of the charts, I still expect an decent oversold rally in crude oil from at or near current levels although in hindsight, I thought that the bounce would have already played out by this point and as such, should have opted to trade USO instead of the leveraged UCO, which has basically choppy around in a trading range since the original entry two weeks ago.
- UCO 60 minute Jan 21st
- USO 60 minute Jan 21st
Regardless of the fact that crude prices did not immediately make a sustained rally towards the initial price targets following the breakout above the 60 minute bullish falling wedge pattern, the sideways price action over the last couple of weeks could be due to the fact that crude is forming a base from which to launch decent rally up to my current preferred target of the 10.58 area (with a suggested sell limit placed slightly below). Any solid and sustained break above the bottom of this recent trading zone would be bearish & most likely open the door to a new wave of selling.
The 18.60 area has formed a decent resistance level over the last few weeks and as such, any solid break above that level is likely to be the catalyst for a relatively quick move towards the 19.80 resistance level (first target on USO) and quite possibly the 20.54 level after that (which is comparable to my 10.58 resistance level on UCO).


