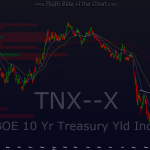
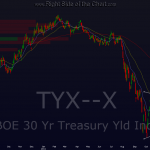
treasury yields drop (and prices rise) when they are bid up by institutional traders as a flight to safety. yes, uncle ben and co. could be doing a little “twist” today but from a technical perspective, this pattern breakdown could portend more downside in treasury yields. here’s the $TNX daily chart, showing a break below a triangle consolidation pattern as well as the $TYX, which is close, but still within a similar pattern. i had also posted a TLT chart recently (T-bond ETF, which shows prices, which are inverse to yields) and how we are near a potential fibonnaci time zone which may possibly signal that rates are about to make a big move one way or the other. i’ve updated that chart below. maybe something to keep an eye on for now.


