Wall Street has become a Hopium Den, with blind optimism that not only will Uncle Ben deliver another round of quantitative easing or some other money printing/counterfeiting ponzi scheme, but that somehow, this next one will be the BIG ONE that finally starts growing the economy and not just inflating asset prices. As I’ve commented on recently, rising equity prices against a back-drop of deteriorating fundamentals can only continue for so long before a reversion to the mean manifests as either a sharp correction in stock prices or a rapid improvement in economic fundamentals. Many economic indicators, such as today’s ISM report, are now at, near, or even below levels typically associated with recession and the overall primary trend on nearly all economic data has clearly been down for months, regardless of any temporary blips.
One can argue that my technical read on the markets is flawed and that I am only viewing the charts through bear-goggles, taking a glass-half-empty approach in my analysis. Maybe, maybe not. Either way, only time will tell. However, from a fundamental perspective I think one would find it hard to argue that the economy is clearly trending lower and some of these key data points are either at, near or even below levels not seen since 2007-2009.
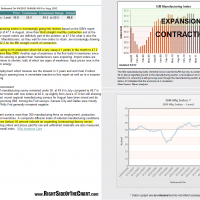
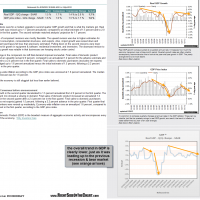
Here are two of the most recent key economic reports, courtesy of Econoday, which I took the liberty of making a few mark-ups on. Remember, these reports can be accessed at anytime using the Economic Calendar under the Tools of the Trade section on the right-hand sidebar of the home page. Once you open the calendar, you can click on any of the reports to view historical charts, descriptions and interpretations of the data. Below are the GDP figures released last Wednesday as well as the ISM Manufacturing Index which was released earlier today. Also keep in mind that with the bollinger bands on the daily index charts pinching together as tight as we’ve seen in years, this market is likely poised for a sharp move soon.


