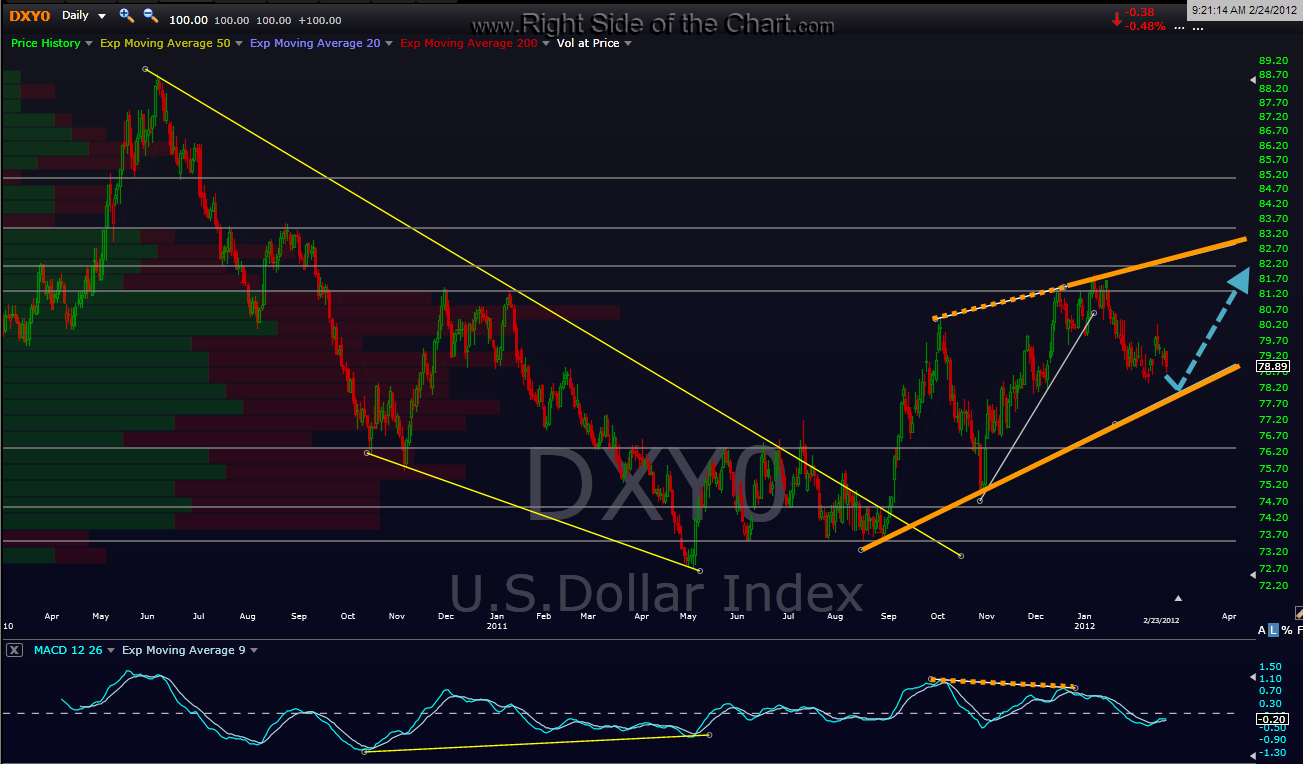
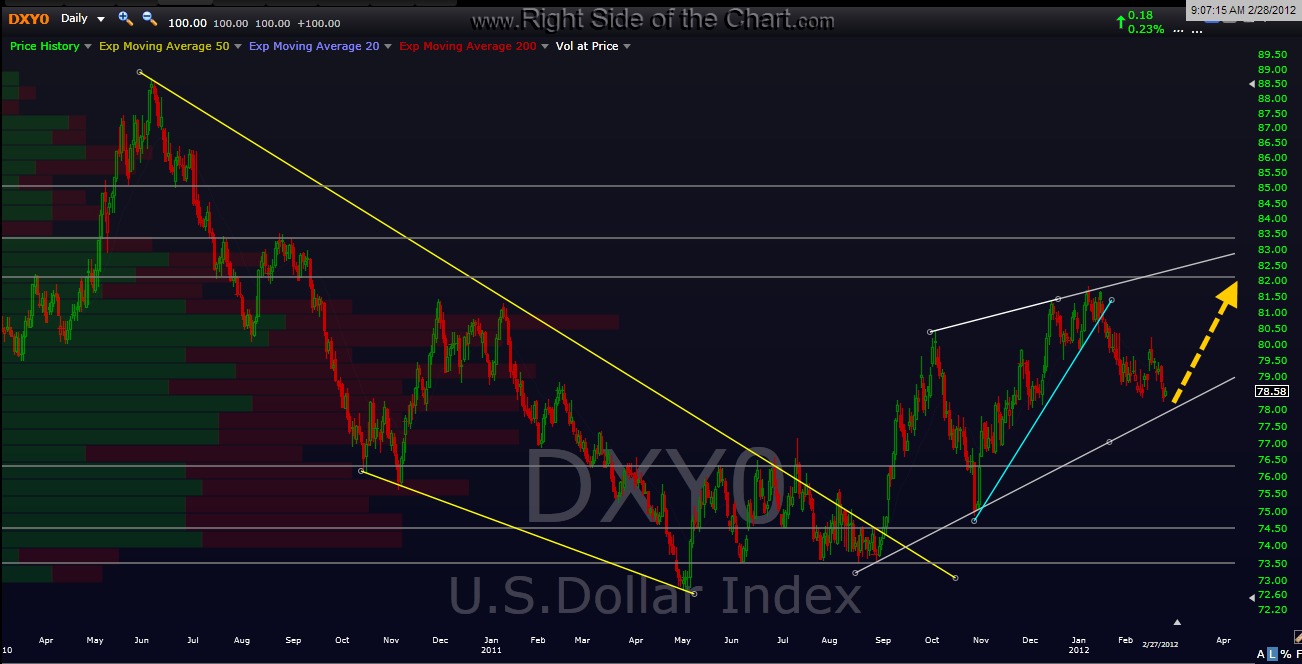
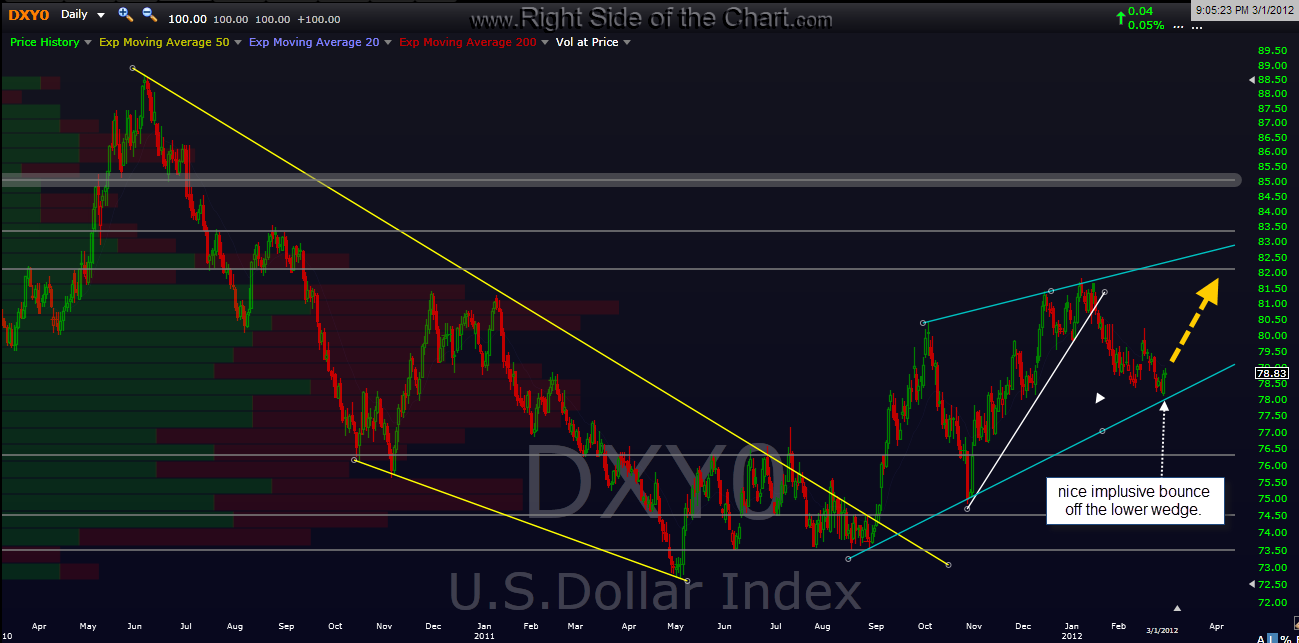
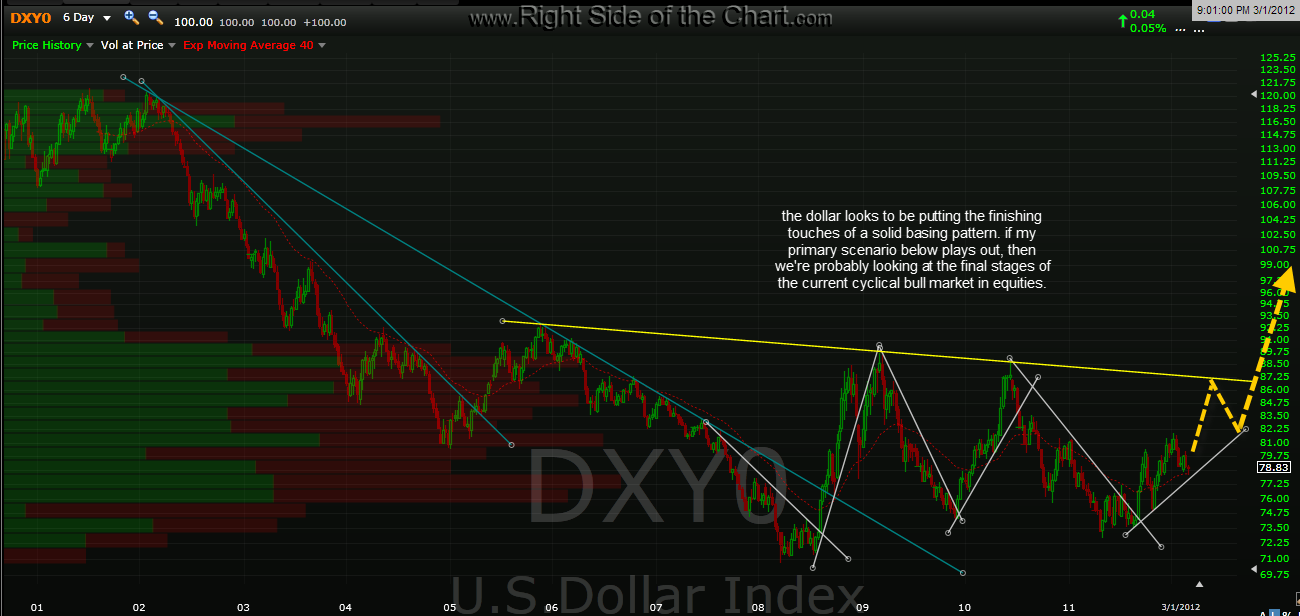
so far, the primary scenario appears to be playing out as the dollar made an impulsive bounce off the lower trendline but it needs to put in a little more distance from that level, possibly even after one more test, to increase confidence in this scenario. i’ve posted the last couple of daily charts in order, including an updated chart plus i’ve added a 6-day period chart below that illustrates what appears to be a very large, potentially powerful base forming in the dollar which would break out above that yellow trendline.
this continues to be my primary scenario for now and if it does play out, then the markets are most likely within days of a top that wouldn’t be seen again for a long, long time. again folks, that’s a big IF and heresy amongst the bulls (which are at a dangerously high majority right now) so if you disagree with the likelihood of that scenario playing out, you are in luck: i will continue posting the best long set-ups as long as i find them and it is the individual stock and sector etf chart patterns which are the primary focus of this site. although i enjoy posting market analysis, my main strength as a trader is the ability to identify the most objective individual stock and etf chart patterns which are often poised for very large moves, as well as the ability to list both clear entry and exit points (the latter being one of the most difficult decisions for most traders). i’ve run into some issues trying to complete the performance spreadsheet but still hope to have it completed and posted soon. by a wide margin, most triggered trades posted here hit their target(s) for some very sizable and quick gains with only a minority of trades being stopped out. i plan to review the charts over the weekend to look for some new set-ups as well as update the existing trades (set-ups, active and completed).