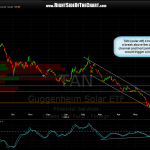
 4 hour chart of TAN (solar etf) shows an objective long entry would be triggered on a break above this downtrend channel AND the horizontal resistance level. currently, both lines are intersecting, which would add to the validity of a break out today or early next week. of course, with today being friday and the european situation continuing to deteriorate with the US economic fundamentals also showing a downward trend, be very selective about taking new positions in front of the weekend and consider keeping your position sizes on the lighter side for now. i am considering adding a new sub-category under the trade ideas to include only etf’s, as many traders prefer the diversity and liquidity of these vehicles over individual stocks. i also want to keep the trade ideas categories as streamlined as possible so feel free to drop me any comments or opinions for or against adding a new sub-category for etf’s.

