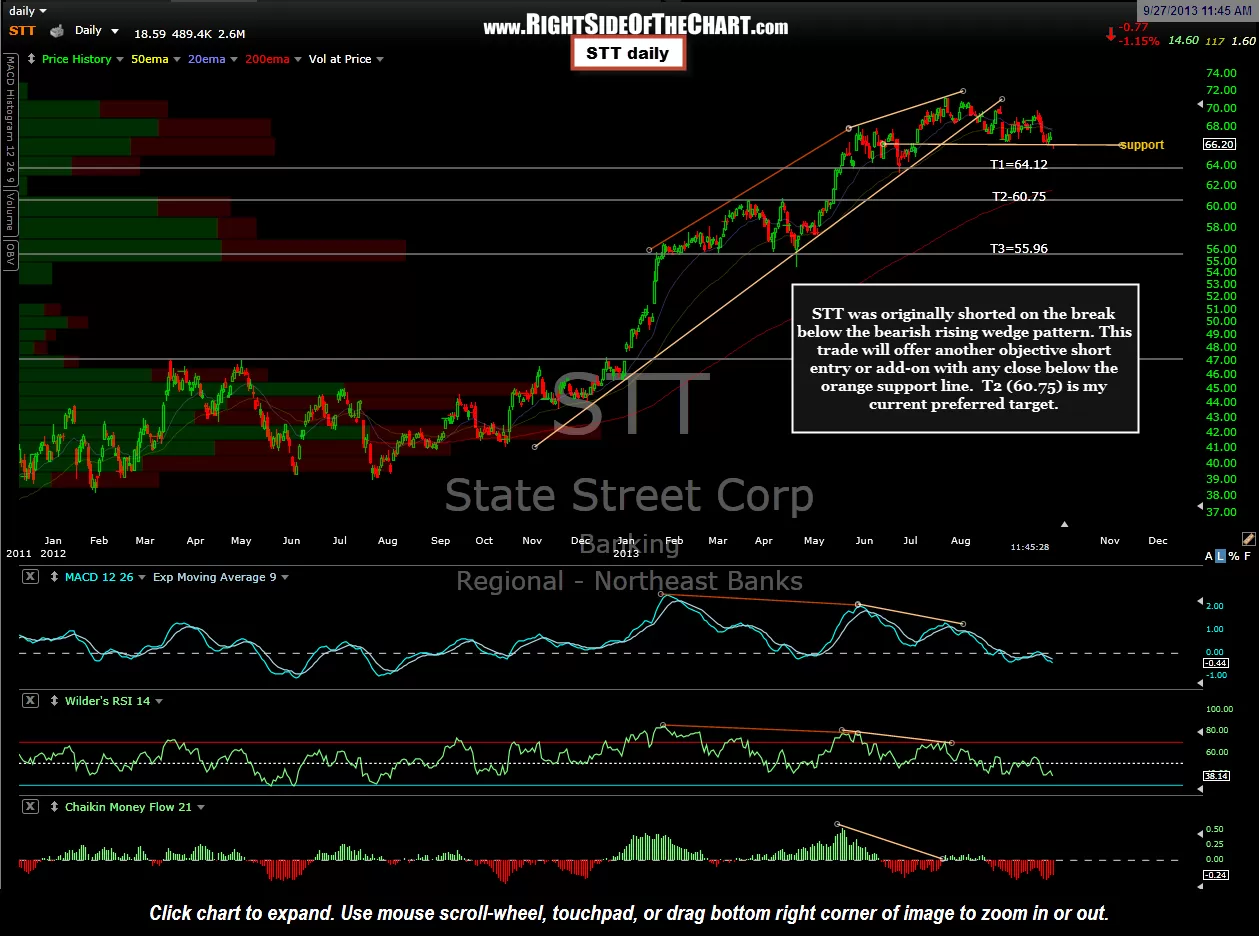
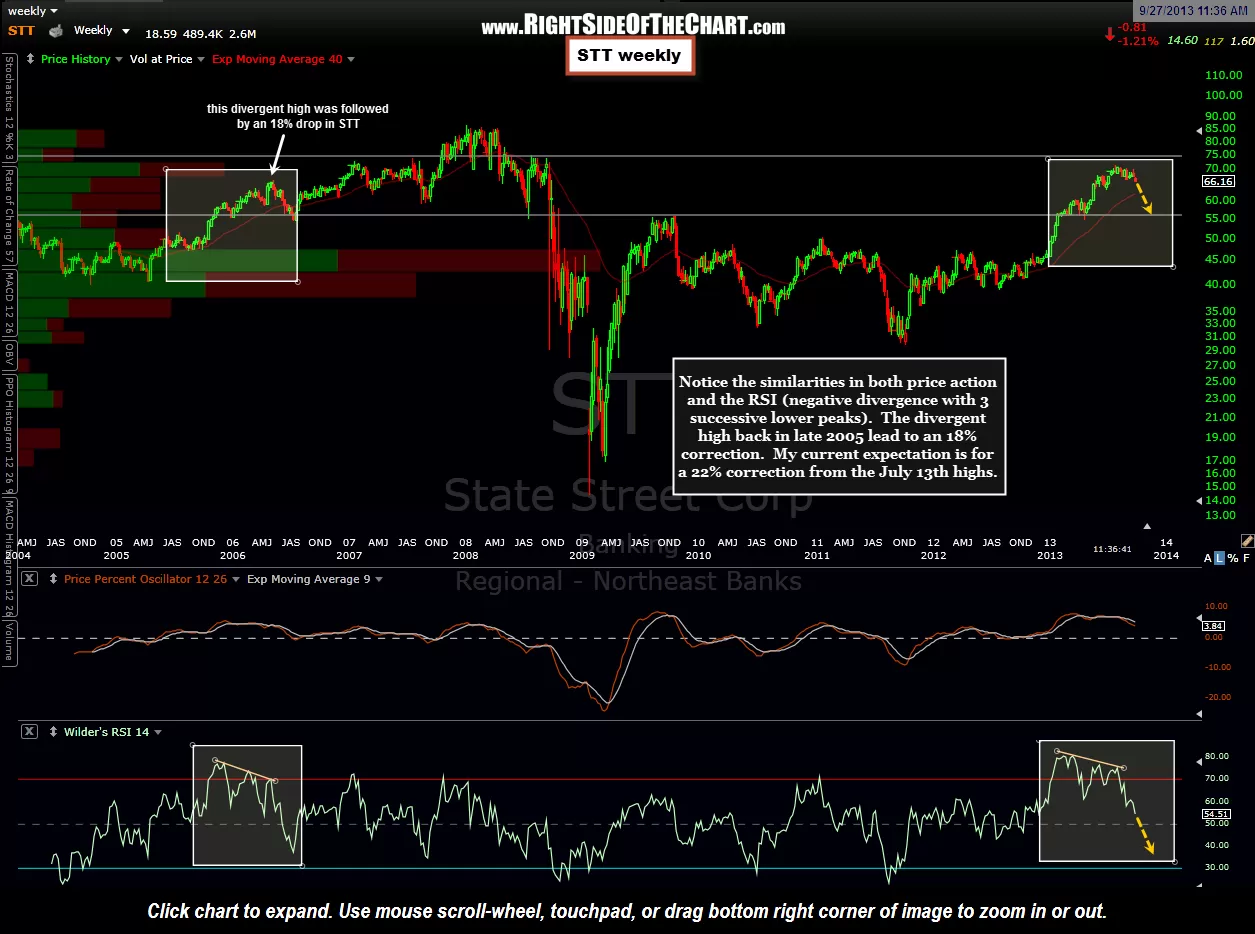
As one of the more promising short trades, STT was originally shorted on the break below the bearish rising wedge pattern and remains profitable at this time. STT will also offer another objective short entry or add-on with any close below the orange support line. Also note the uncanny similarities on the advance of the stock leading up to its highs on the week of May 12th, 2006 with the most current advance (as shown on the weekly chart below). As back then, State Street Corp has put in negative divergences nearly identical in time and slope, each with the RSI making a series of three successive lower peaks while the stock price continued to climb. That divergent high back in late 2006 was immediately followed by an roughly 18% correction in STT, with the RSI continuing to fall to around the 37 level. My current weekly swing target would be the 56 area or roughly a 22% drop from the recent highs from the week of July 26th.

Results for {phrase} ({results_count} of {results_count_total})
Displaying {results_count} results of {results_count_total}