
As there haven’t been any significant new technical developments in the major stock indices to highlight recently, I figured that I’d just post a couple charts with the key levels & potential developments that I’m watching for at this time. In reviewing the charts today, I just realized that the IWM short trade which was entered all the way back in June, finally has an update to report following months of an unusually long sideways go-nowhere grind.
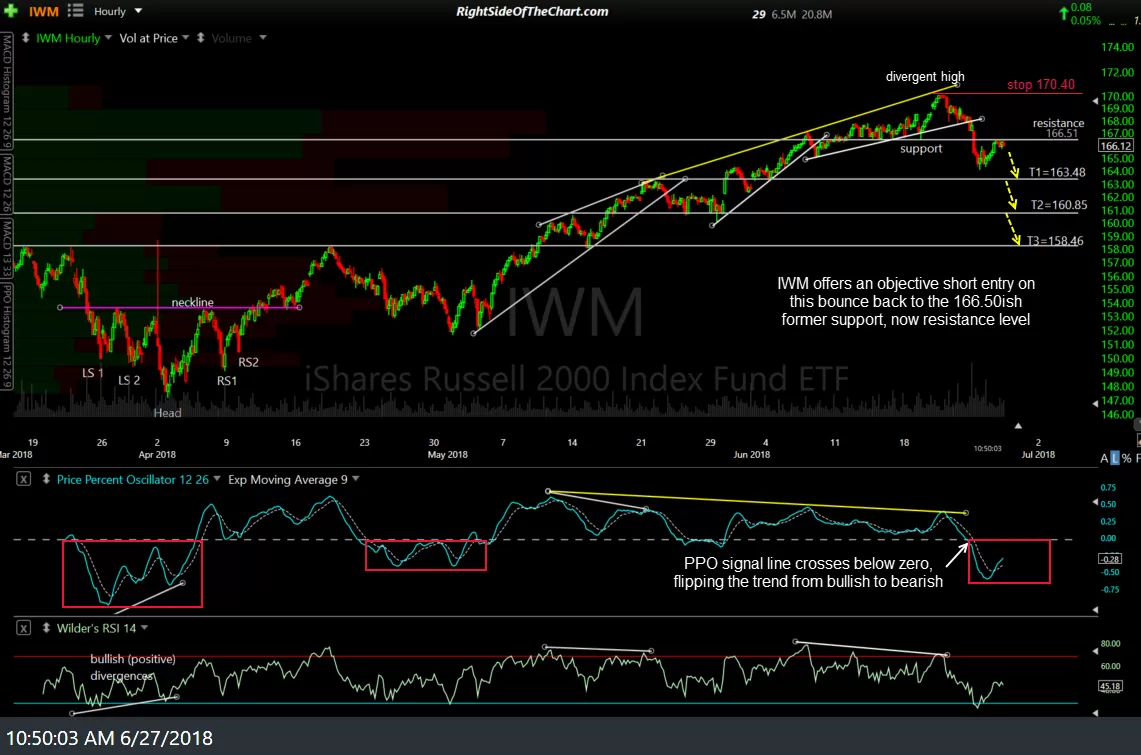
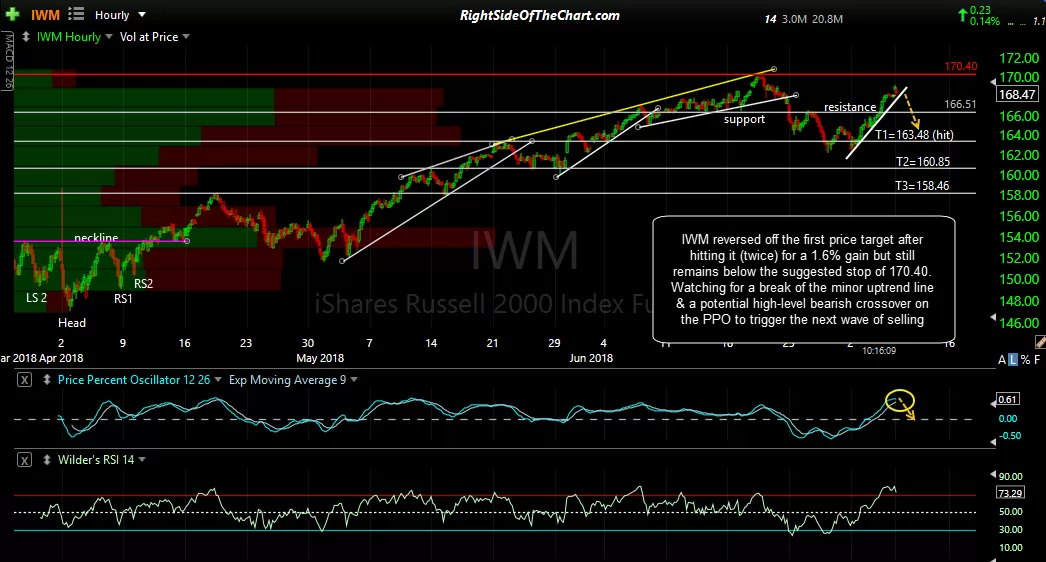
The IWM short trade was entered back on June 27th on a snapback rally to resistance following a breakdown on the 60-minute charts. Swing trade ideas based on intraday time frames usually only last just days or weeks but in this case, after a near-perfect entry with IWM immediately reversing & quickly going on to hit the first price target for a 1.6% gain, the ETF reversed off T1 & has traded sideways since, going on to hit the suggested stop of 170.40 on Tuesday resulting in a 2.6% loss for those that did not book partial or full profits at T1. All associated posts with that trade will now be moved to the Completed Trades archives. Previous & updated 60-minute charts below (click to expand):
-
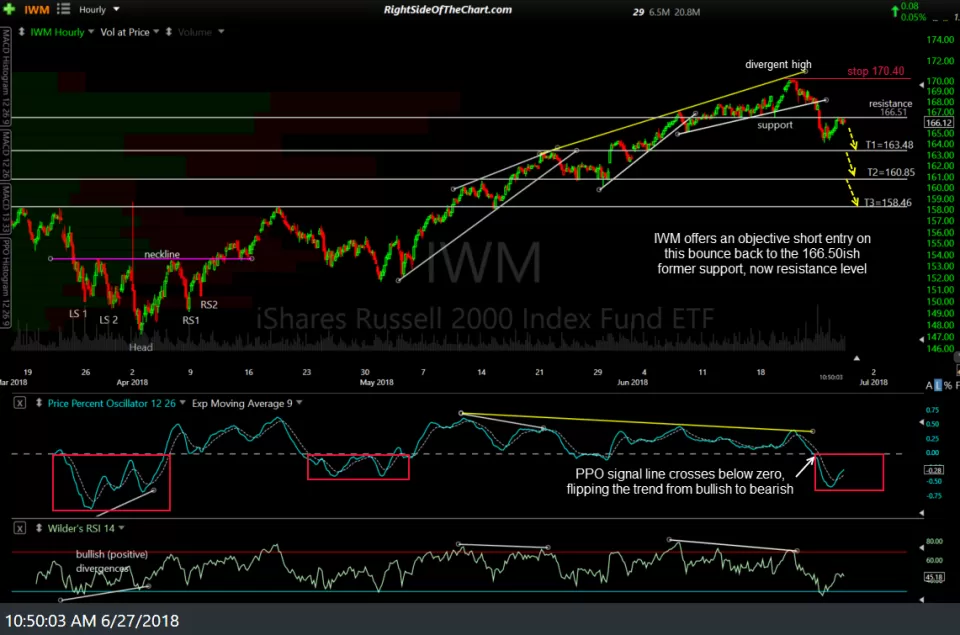
- IWM 60-min June 27th
-
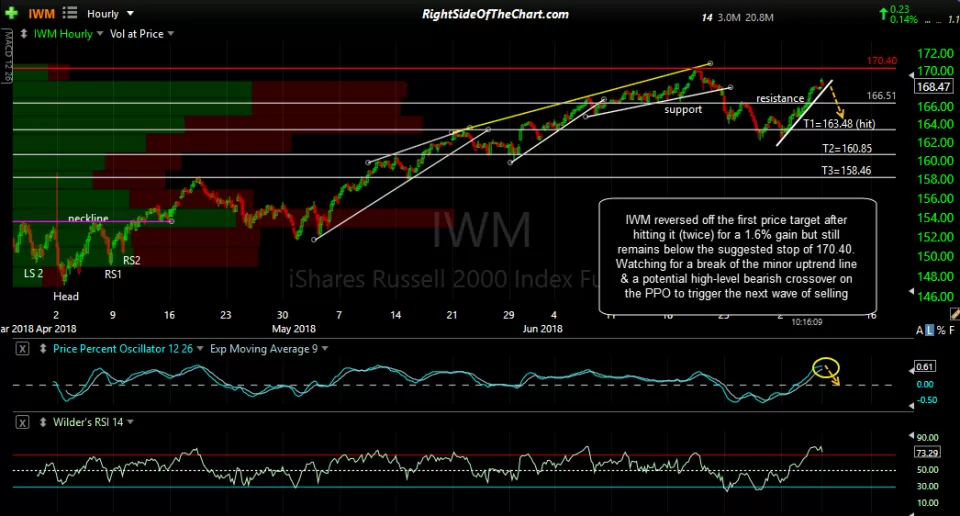
- IWM 60-min July 9th
-
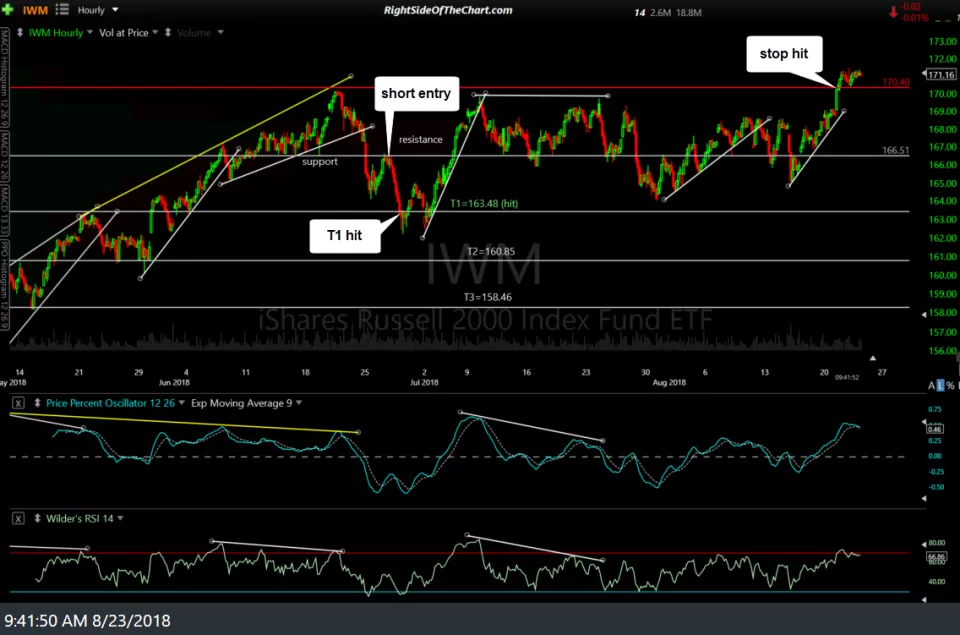
- IWM 60-min Aug 23rd

The next chart below is a 2-year daily chart of IWM highlighting the series of divergent highs & subsequent corrections. When IWM popped above the recent trading range on Tuesday, it put in the most recent divergent high. While there is already negative divergence on IWM as of now, there is plenty of room for more upside over the next week to keep the divergences intact. Whether or not IWM continues to rise over the next week or so, the next sell signal will come on a break below the minor uptrend line with a minimum target area for the next correction in IWM runs from the uptrend line to the 160 level.
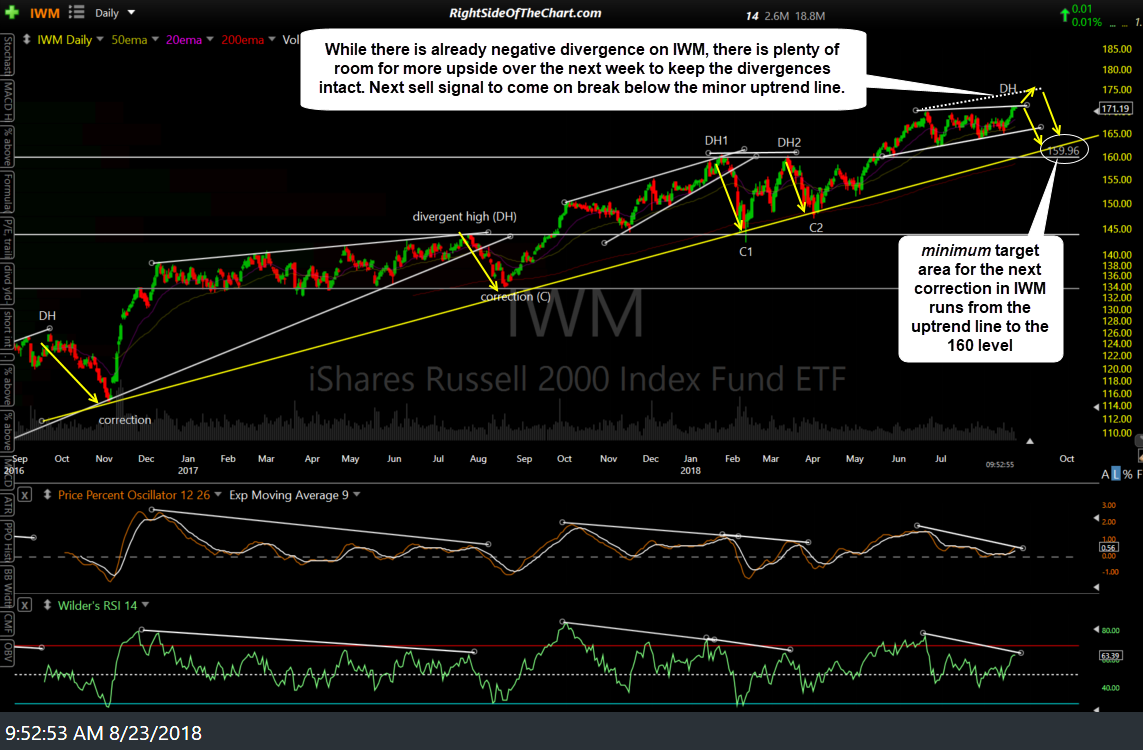
IWM daily Aug 23rd
Moving to the other end of the market cap spectrum, SPY continues to struggle with the breakout to all-time highs with any breakout most likely to fail within days to just a couple of weeks as the divergences between price & the momentum indicators continues to build. Watching for a break below this minor uptrend line for a sell signal. Daily chart:
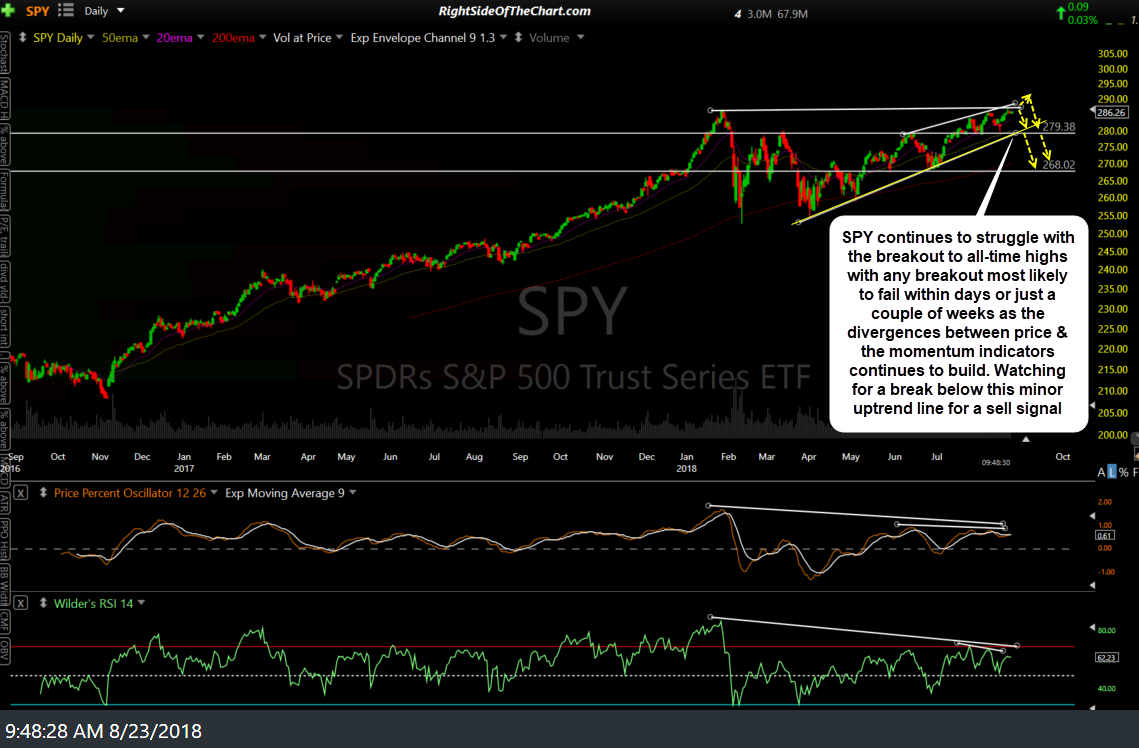
SPY daily Aug 23rd
Likewise, QQQ continues to slowly grind higher within this bearish rising wedge, confirmed with negative divergences with a sell signal to come on a break below the yellow uptrend line.
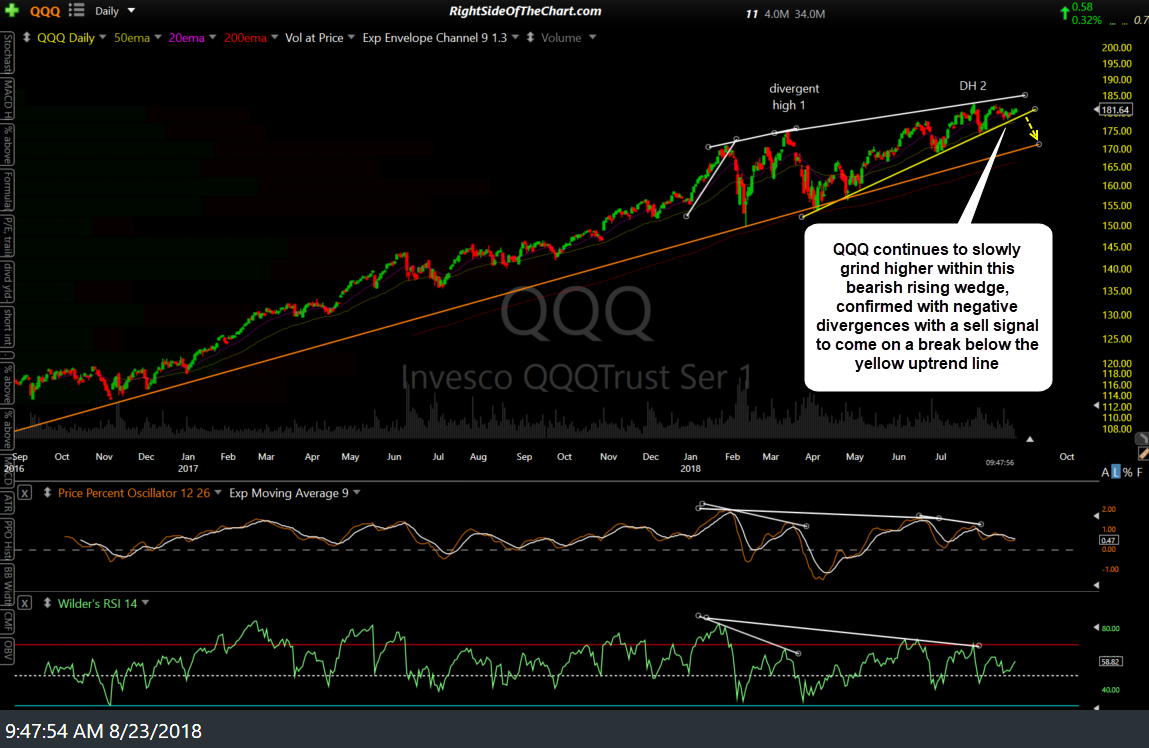
QQQ daily Aug 23rd