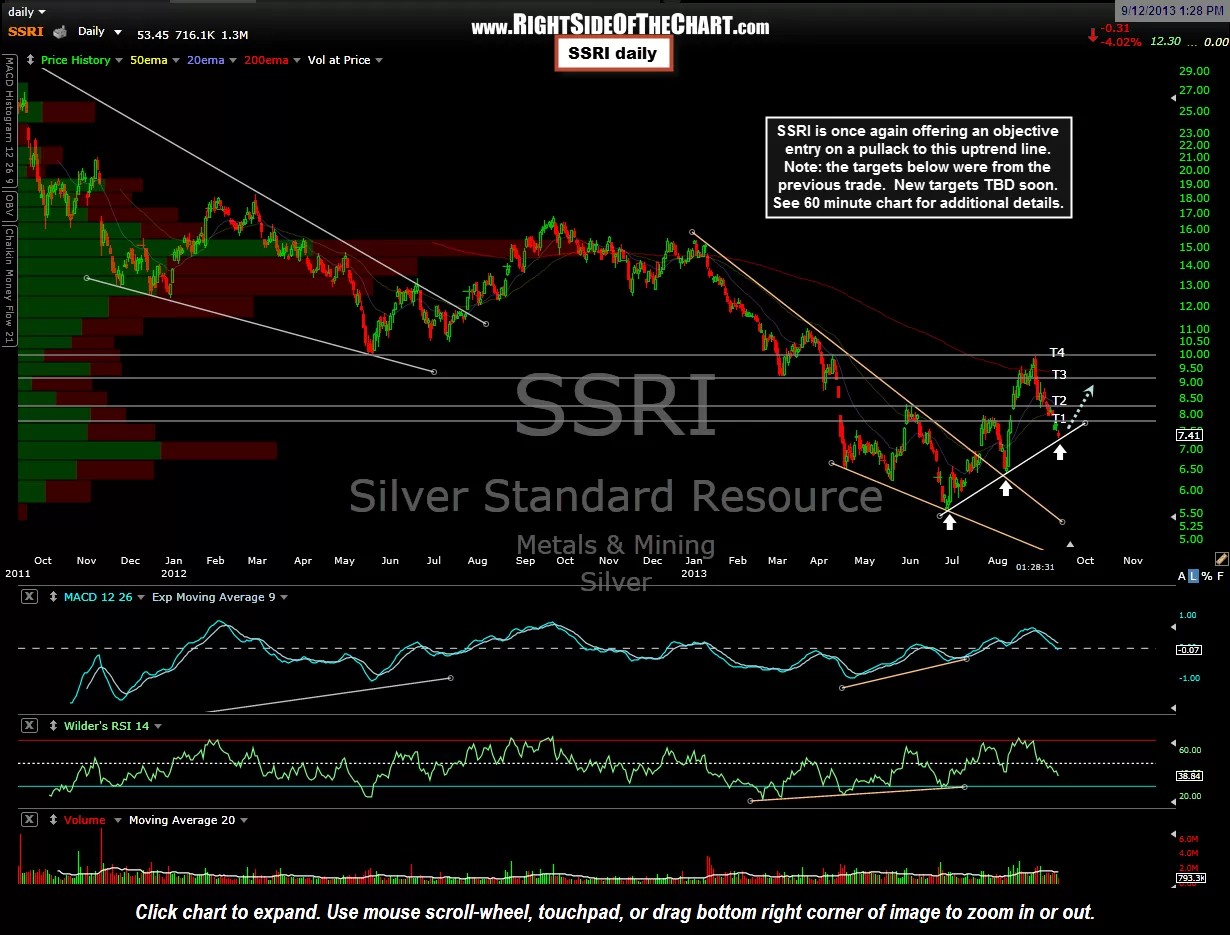
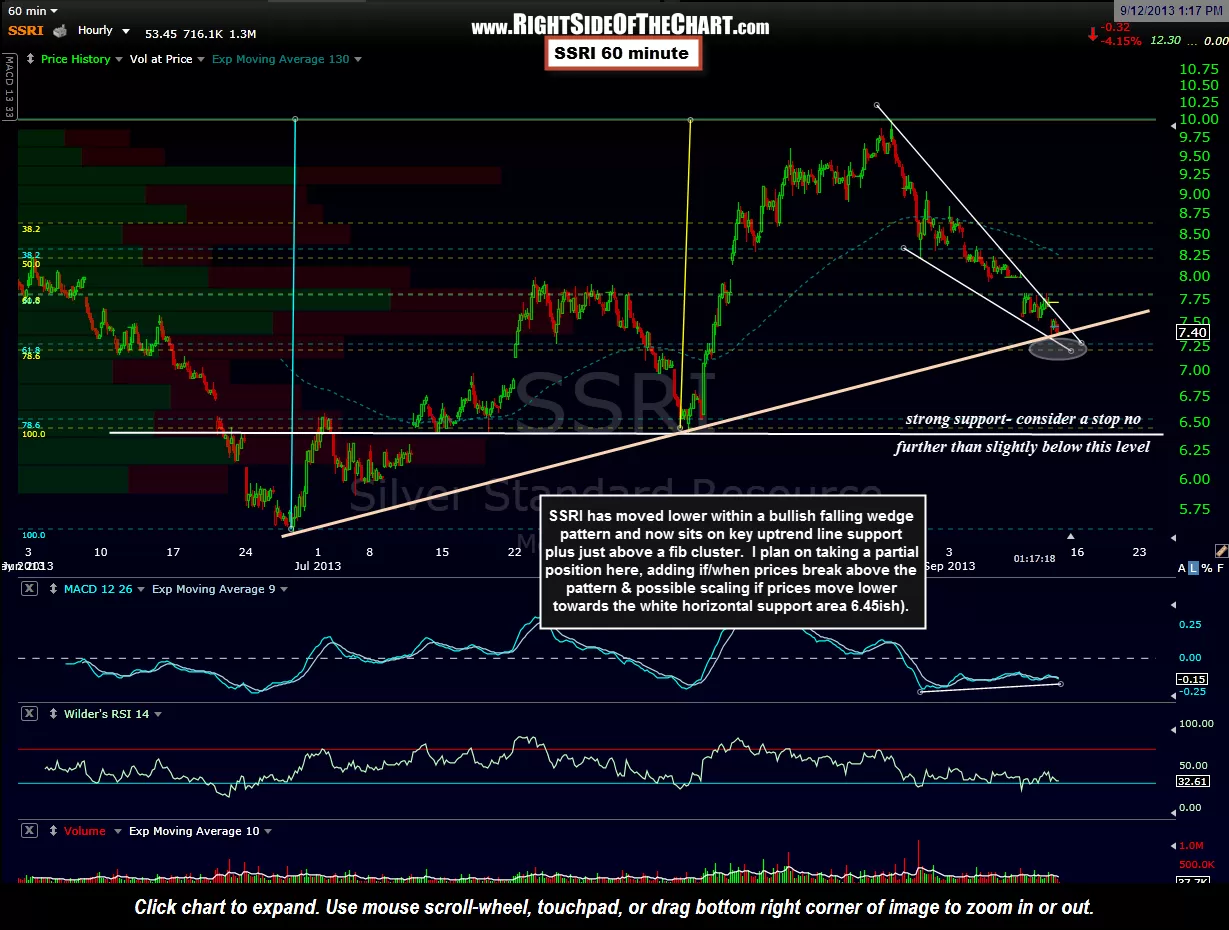
SSRI was one of my favorite longs in the mining sector when I started buying my Top 10 Picks in the sector when the gold & silver stocks bottomed on June 26th. As I go through the individual components of the sector today, SSRI once again looks to be one of the more attractive long candidates. SSRI has moved lower within a bullish falling wedge pattern and now sits on key uptrend line support plus just above a fib cluster. I plan on taking a partial position here, adding if/when prices break above the pattern & possible scaling if prices move lower towards the white horizontal support area 6.45ish. Note that the targets on the daily chart were the targets from the previous trade, although I suggested booking full profits when T3 was hit for as the stock was already up 64% from the first post. However, as is often the case, this chart illustrates how many of the trades posted here will reverse trend upon reaching the final target. I will follow-up with the suggested target levels for the new trade asap. The 6.45ish support level highlighted on the 60 minute chart is a fairly liberal stop so for those interest in SSRI only for a quick potential “bounce off support” trade, consider using a tighter stop. Daily & 60 minute charts:

Results for {phrase} ({results_count} of {results_count_total})
Displaying {results_count} results of {results_count_total}