
Below are the daily charts of the SPY, QQQ, & IWM. As noted on these charts, we have potential negative divergences forming on both the MACD & RSI, which more often than not lead to corrections. Although technically speaking we have negative divergence in place on these indicators with prices making new highs without the indicators/oscillators doing so, I consider this “potential” divergence with “official” negative divergence in place only when the MACD turns back down and makes a bearish crossover (i.e.- the MACD line crosses back down below the signal line). At that point, we then have a confirmed series of lower highs on the MACD against higher highs in prices.
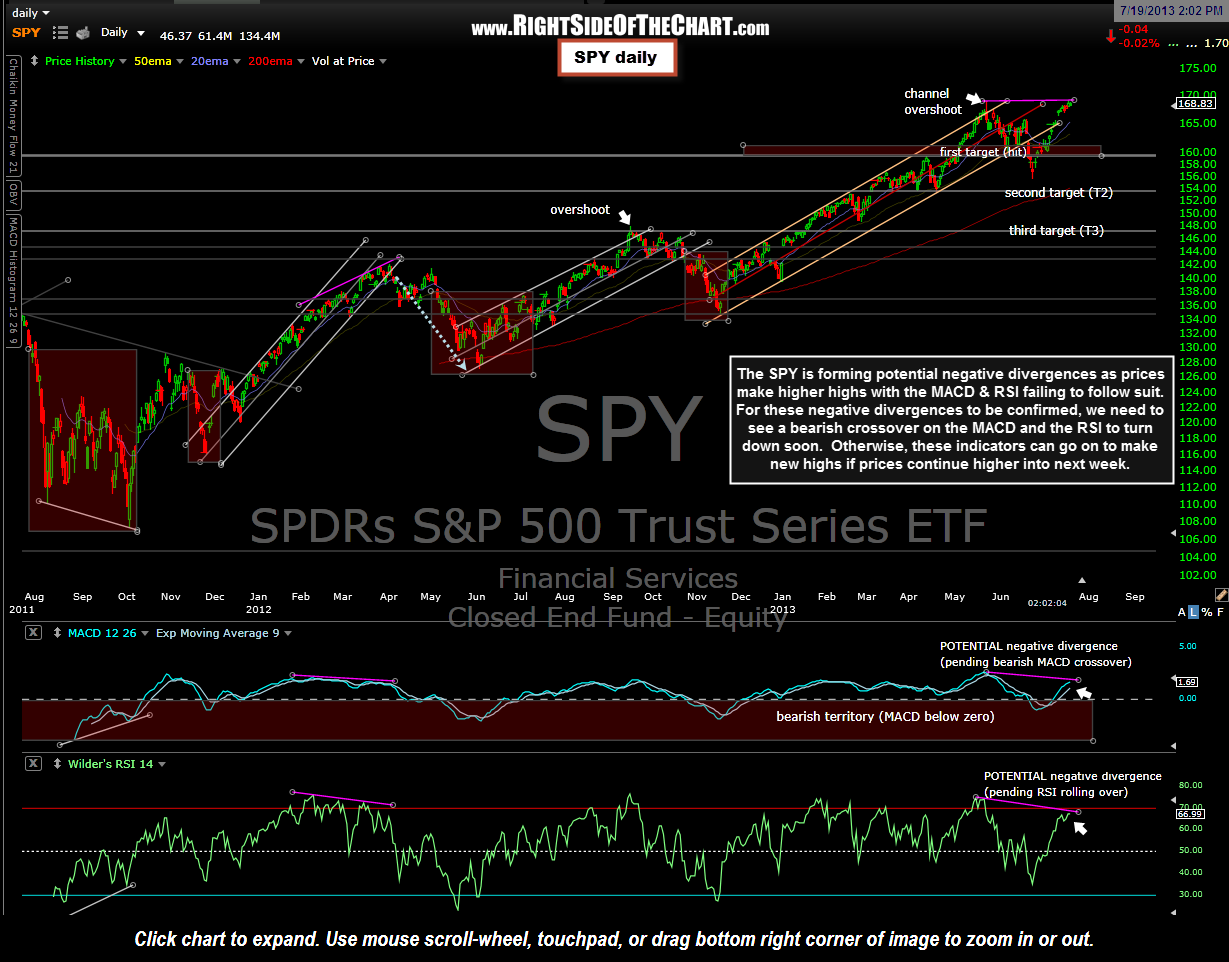
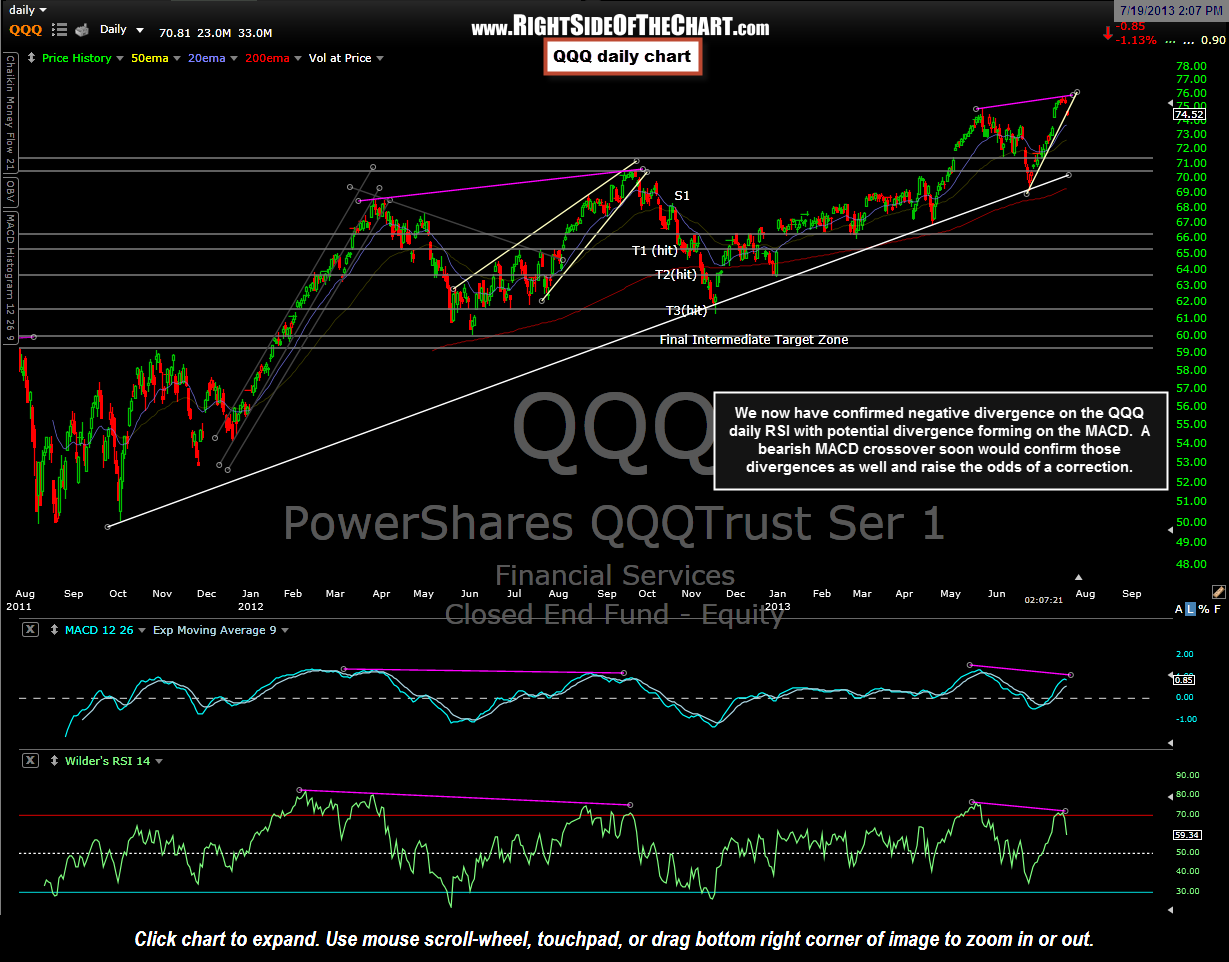
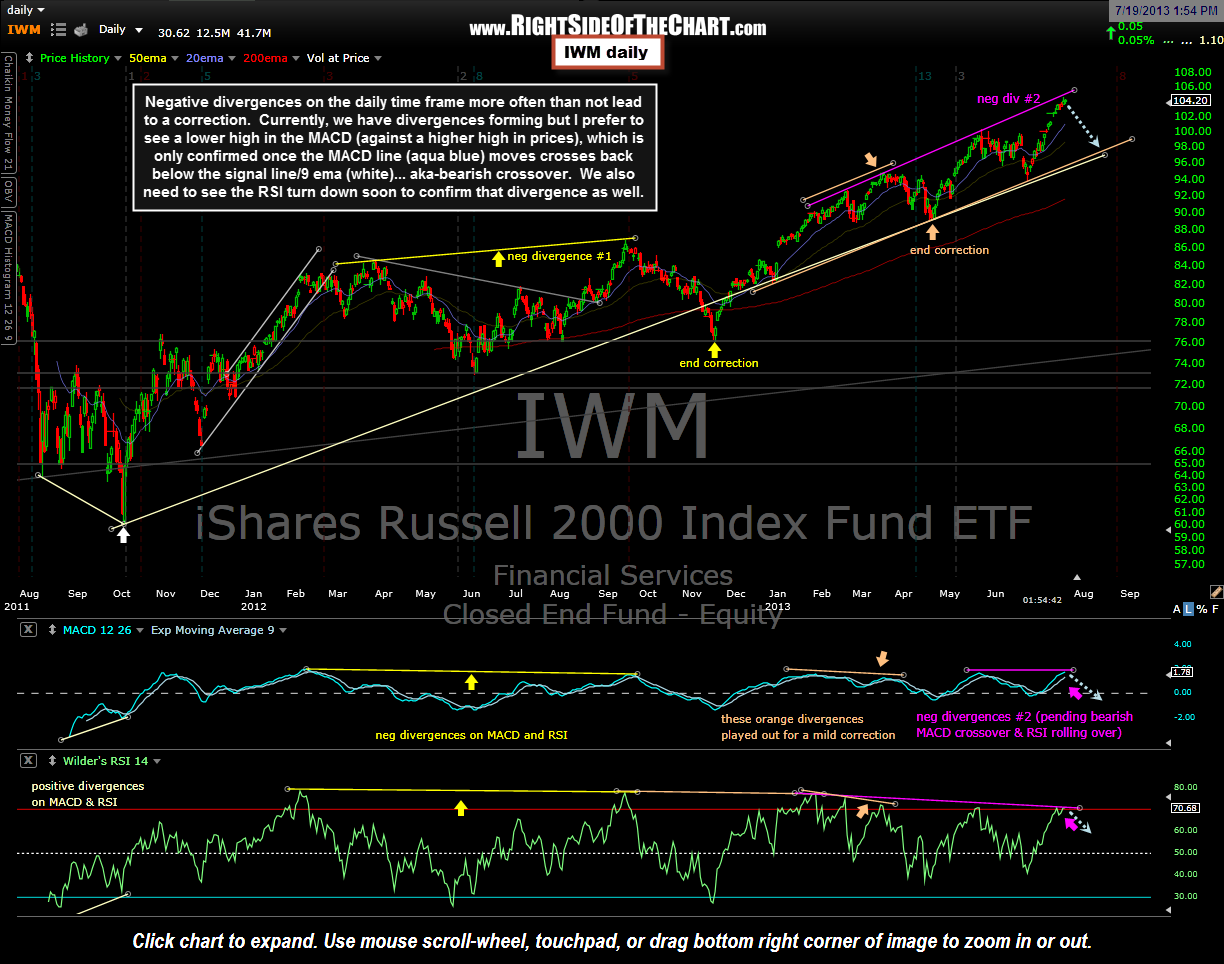
Although one could say that the MACD is diverging against prices right now, as it is, we could also see the MACD go on to make a higher high if prices were to continue higher from here, thereby undoing any negative divergence. Hence, the differentiation between potential & confirmed negative divergence. Ditto for the RSI although with only a single line (vs. two lines on the MACD), I wait for the RSI to turn down while prices are still move higher, as it recently has with the QQQ/$NDX.
In summary, until we see prices break below those sub-uptrend lines (smaller trendlines within the larger pattern) as well as confirmed negative divergences put in place, the uptrend remains solidly intact. I’m also watching the 15 minute SPY chart for some of the early trend reversal signals such as a MACD cross below the zero line as well as a 34/14 ema bearish cross. These would be early signs of a short-term trend change and from there, we’ll just have to assess things as they go.
It’s not uncommon to see a breakout to new highs fail shortly after with prices dipping back below that level to shake out some longs and pull in some more shorts before going higher so I’m not going to read too much into the fact that all major indices have fallen back below those new highs levels today. What I am more interested in are the minor & major trendlines as well as horizontal support levels on the major indices and whether or not these potential divergences are confirmed soon, which would likely happen on any additional downside over the next few trading sessions. Until then, my preference is not to enter any new positions on either the long side (due to the red flags) nor the short side (as nearly all time-frames are still on buy signals). Based on where things stand now, I would say that next week will most likely tell us if this recent breakout to new highs has more room to run or if it will prove to be a one-day wonder with a correction that began today. Therefore, I will spend some time over the weekend continuing to update the trade ideas as well as look for any new trade setups that standout.
Have a great weekend!