
SOYB (Soybean ETF) will trigger a long entry on a break above the bullish falling wedge pattern (white downtrend line). Prices targets listed on chart are adjusted for optimal fill (set slightly below the actual resistance level/expected reversal points). Suggest stop TBD depending on the entry price. A daily chart of $SOYB (Soybean Spot Prices) has also been included below.
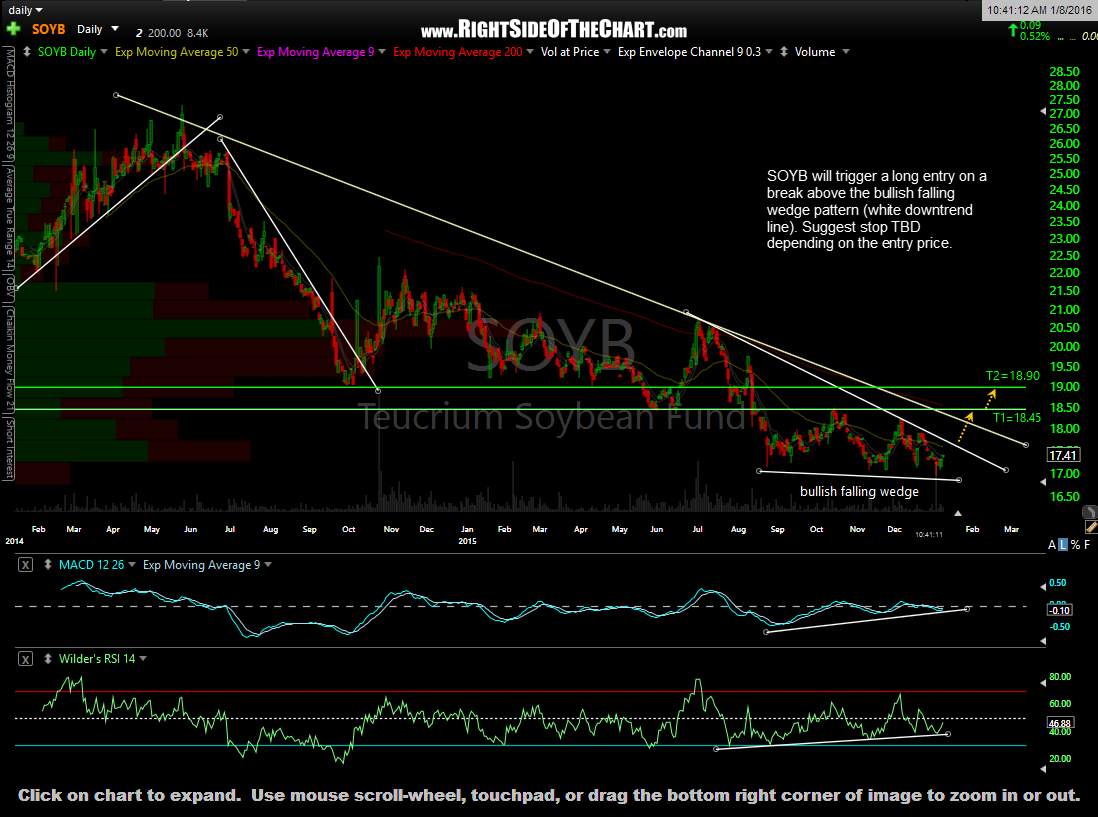
SOYB daily Jan 8th
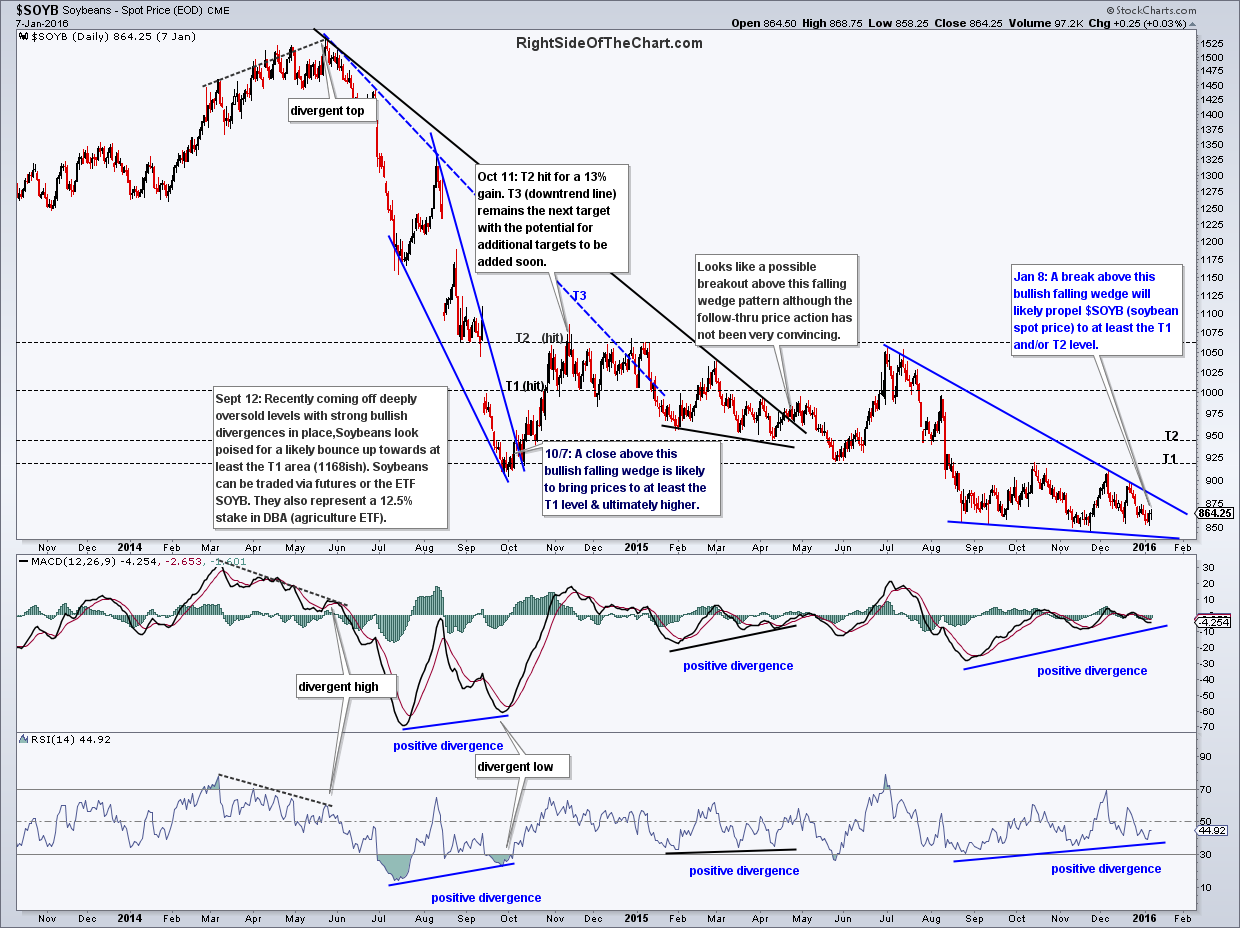
$SOYB daily Jan 8th