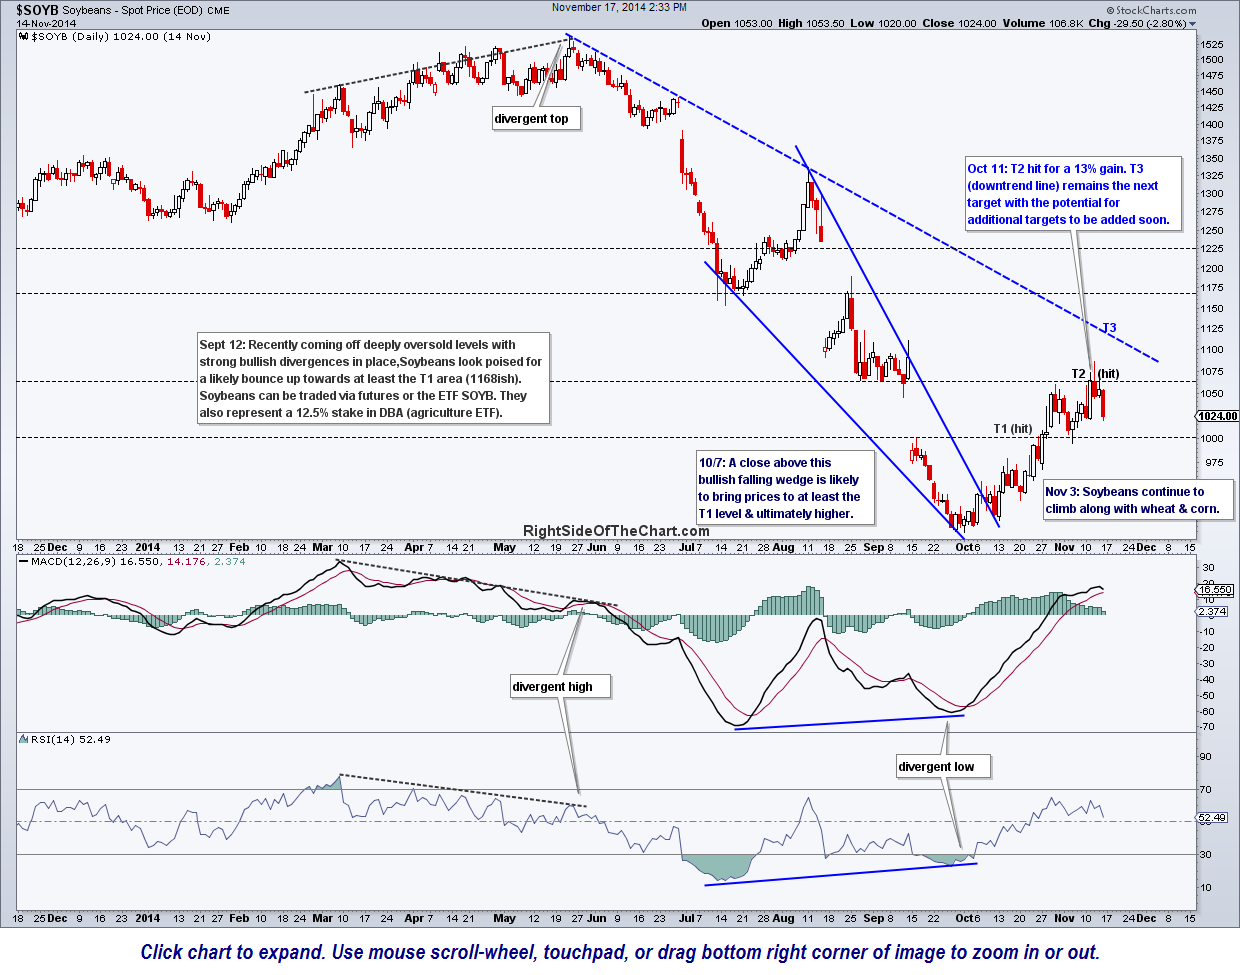
The SOYB (Soybean ETF) long trade hit the second target for a 13% gain last week. T3 (the downtrend line) remains the next target with the potential for additional targets to be added soon. As previously discussed, my preference on this trade is to use the charts of $SOYB (soybean spot prices) in lieu of SOYB (the soybean tracking ETF) in determining the entry & exit points on the soybean ETF as the ETF is thinly traded and the charts are not as clear. As with the other agricultural commodity trade ideas, SOYB has the potential to morph into a longer-term trend trade/investment depending on how they trade going forward. Previous & updated daily charts of $SOYB below:
-

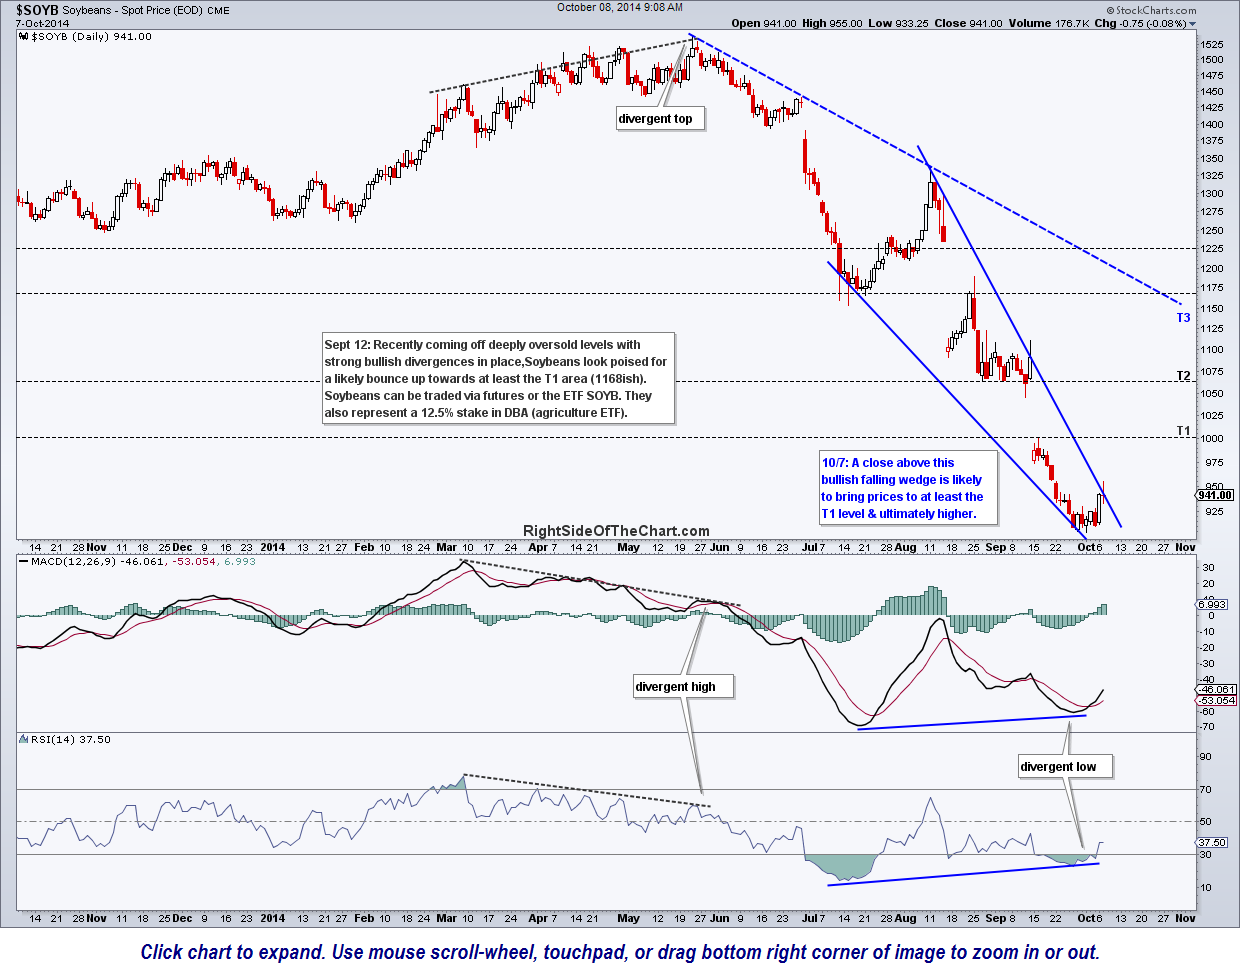
- $SOYB daily Oct 8th
-
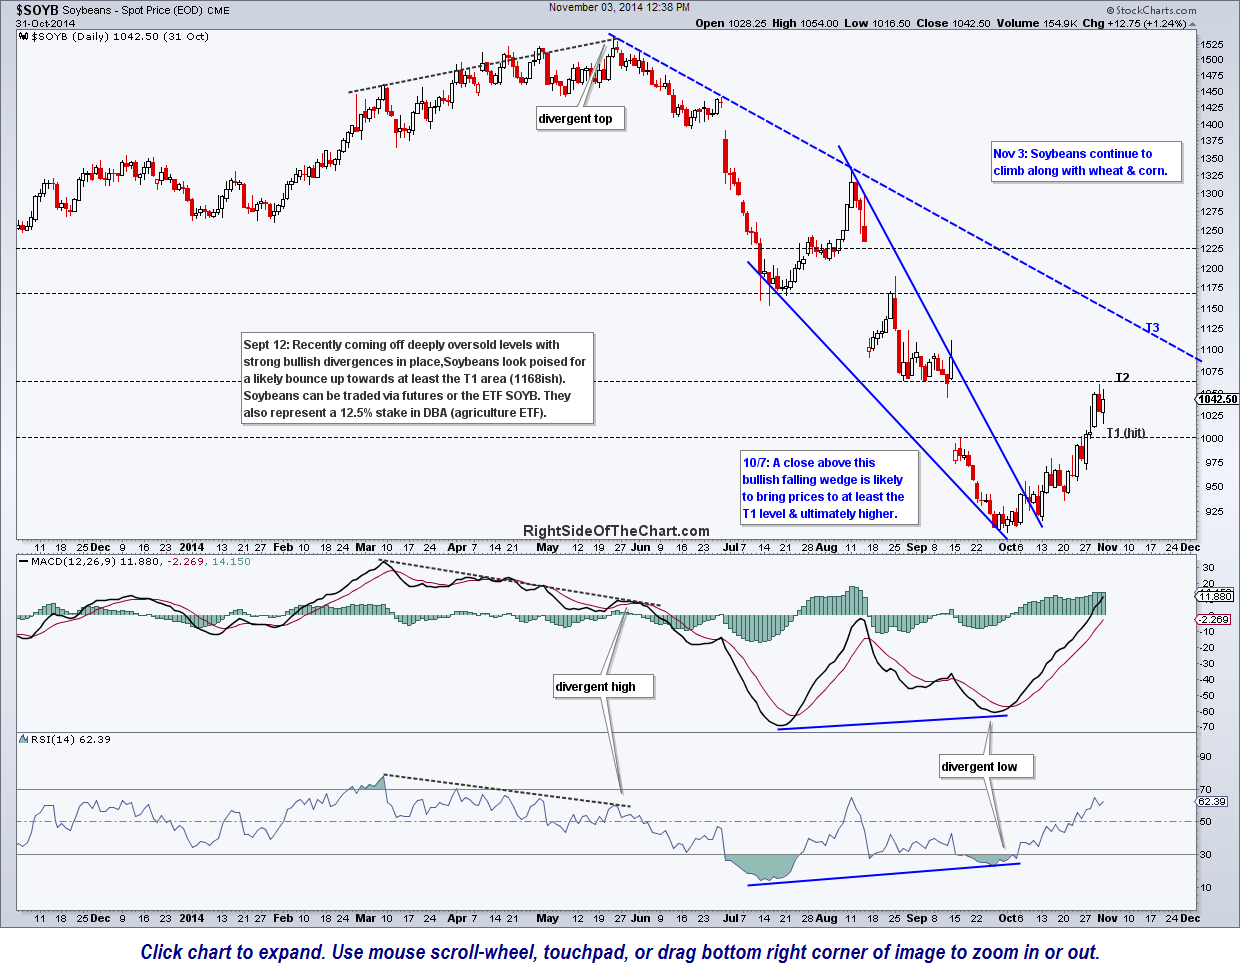
- $SOYB daily Nov 3rd
-
- $SOYB daily Nov 17