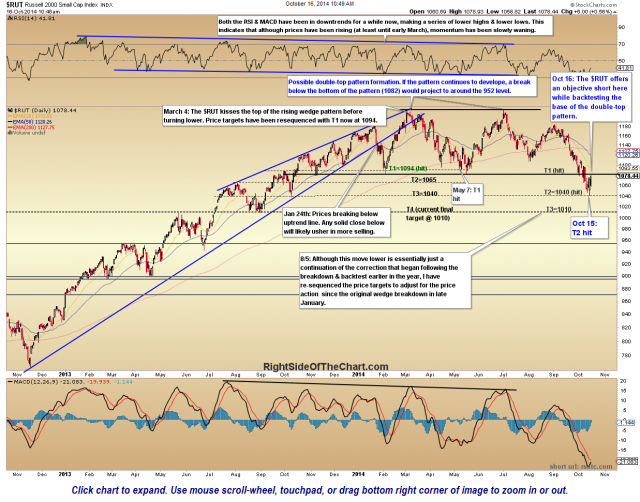
Yesterday, the $RUT (Russell 2000 Small Cap Index) hit the second downside target (T2 at 1040) that has been listed on the daily chart under the Live Charts page for months now. As if most often the case, the typical reaction (bounce and/or consolidation) immediately ensued. That bounce is now approaching the base of the double-top pattern that I’ve also been highlighting on that same chart for months now as well. In fact, the base of that double-top patten was the first downside target which was just recent hit & then taken out a few sessions later, triggering a breakdown of that pattern which actually projects down to the 960 area, a drop of about 11% from current levels if reached.
With the bottom of that double-top pattern at the 1080-1082 level & the $RUT trading at 1081 as I type, a short entry here on the $RUT (IWM) with the appropriate stops somewhat would have to be consider a very objective entry with a very favorable R/R (risk-to-reward ratio. As such, IWM will be added as an Active Short Trade here around the 107.50 level.
I will follow up with the specific IWM targets soon but just wanted to get this trade idea out asap in case we do get the expected reversal off of this backtest of the 1080-1082ish resistance level. For those preferring to use one of the leveraged ETFs as a proxy for an $RUT short (TWM, TZA, etc…), keep in mind that this trade is intended as a multi-week swing trade and therefore, at most I would consider using TWM (2x short $RUT) as the decay on the leveraged ETFs, especially the 3x like TZA, will almost certain impact the returns if held for more than just a few days.
The live, annotated version of the $RUT daily chart can be accessed via the Live Chart Page or the Live Charts Links widget box on the right-hand sidebar of the home page.


