
IWM (Russell 2000 Small Cap Index ETF) continues to test the uptrend line off the Feb lows over the past 6 trading session with another tag & bounce off that level today. However, the divergences in place & proximity of prices to the apex of the wedge still indicate that a breakdown & correction is likely to occur soon.
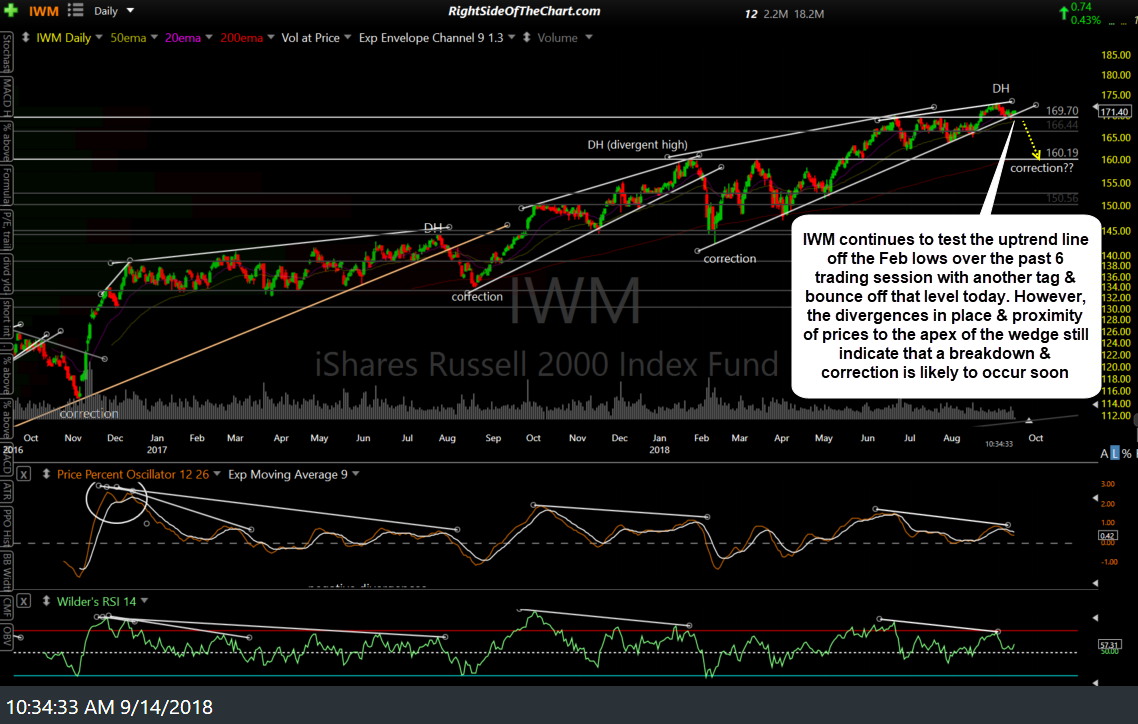
IWM daily Sept 14th
Zooming down to a 60-minute chart, so far today we’ve had an intraday rip in IWM which has taken it close to the 171.60 resistance level. An impulsive break and/or 60-minute close above this level could open the door for a test of the recent all-time highs in the small caps while a rejection here could send the index back down for another test of the primary uptrend line.
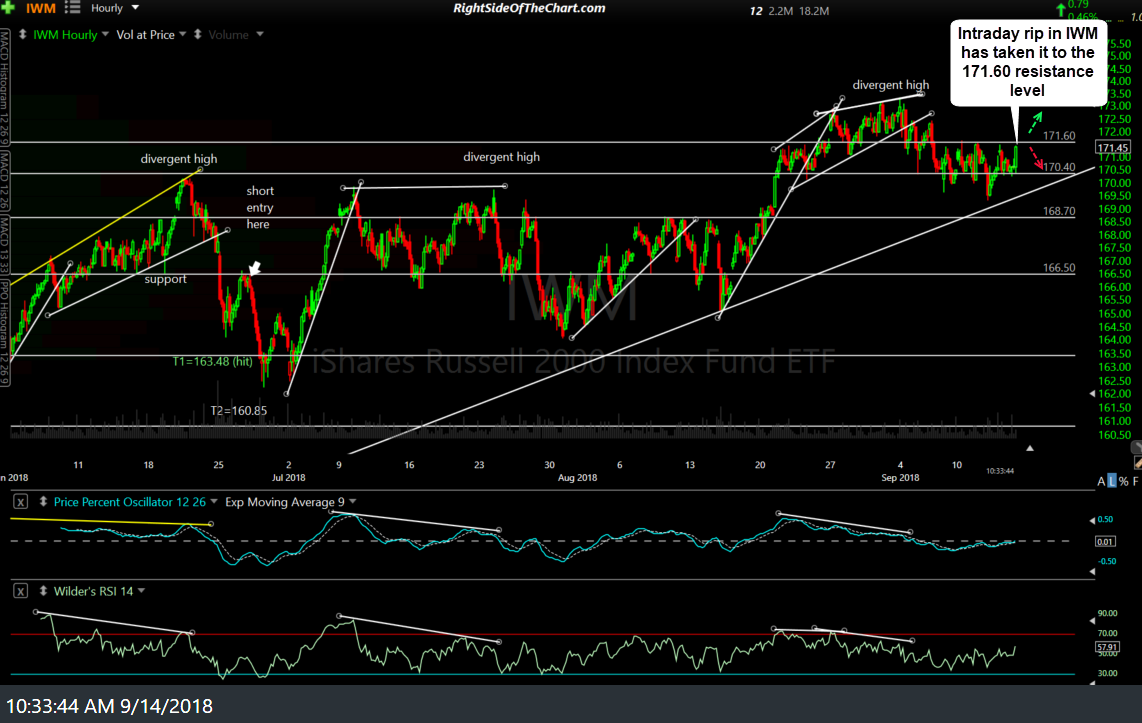
IWM 60-min Sept 14th
As of now, we do not have any sell signals on the small caps & as such, my preference would be to hold off on any short positions until & unless we get a convincing break below the daily uptrend line. I don’t care to go long on a break above the 171.60 resistance or the recent all-time high of 173.39 as long as the divergences remain intact as any breakout in the coming weeks would have an increased rate of failure.