
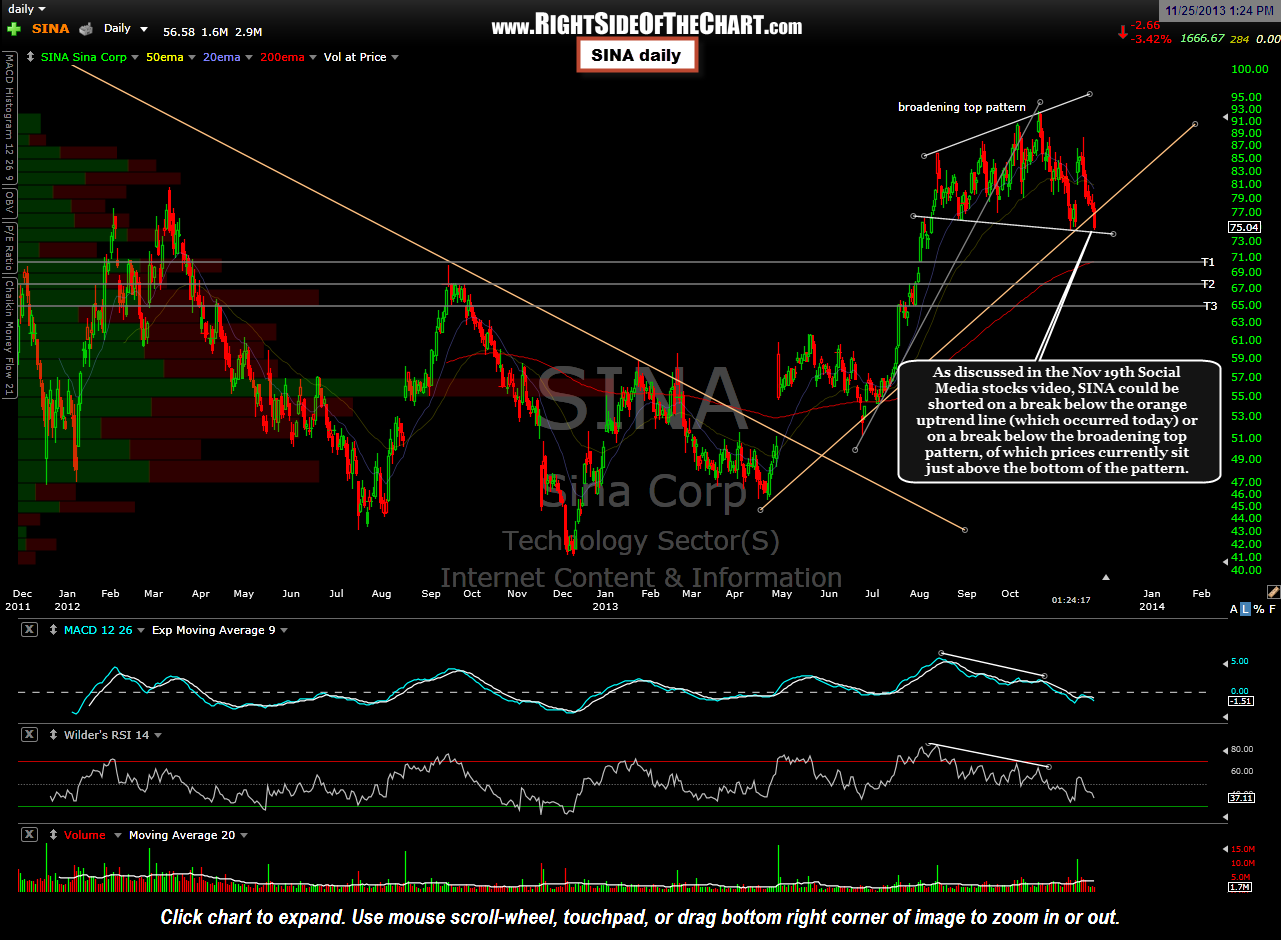
 As discussed in the Nov 19th Social Media stocks video, SINA could be shorted on a break below the orange uptrend line (which occurred today) or on a break below the broadening top pattern, of which prices currently sit just above the bottom of the pattern. A break below the pattern will trigger the next add-on or objective entry. Price targets have been added to this updated daily chart with the exact suggested profit taking levels to follow.
Regarding the trade ideas, I have been on the lookout for long trade ideas offering objective risk/return ratios but don’t see many candidates that fit the bill. There are some continuation patterns out there but most of those stocks are very extended and have nearly as much, if not more, downside risk (such as the increasing rate of large gap downs lately) as they do upside potential. The market could easily continue this slow-grind higher into year end or may roll over before then. This continues to make trading difficult for all but the momentum traders as even the dip buyers aren’t getting many long entry opportunities as we haven’t seen a half-decent pullback since the late Sept/early Oct dip.
As such, my preference is to keep things light for now, focusing on the most attractive chart patterns, long or short. Short trades remain counter-trend trades on all time frames (short, intermediate & long-term) and as such, are prone to a higher than normal rate of failure following selling signals such as breakdowns below trendlines, horizontal support or bearish price patterns. However, there’s always a bull or bear market somewhere & I continue to remain bearish on the social media and solar stocks at this time (preferring shorting select stocks vs. the sector ETFs).