
The chart on YUM (Yum! Brands Inc.) doesn’t look so yummy to me. In fact, it looks quite ugly. YUM recently pounded out a triple-top high with solid negative divergences in place on both the daily & weekly time frames. The breakdown of this bearish rising wedge pattern on the daily chart provides an objective, well-defined short entry at current levels (YUM actually just backtested the pattern today as well).
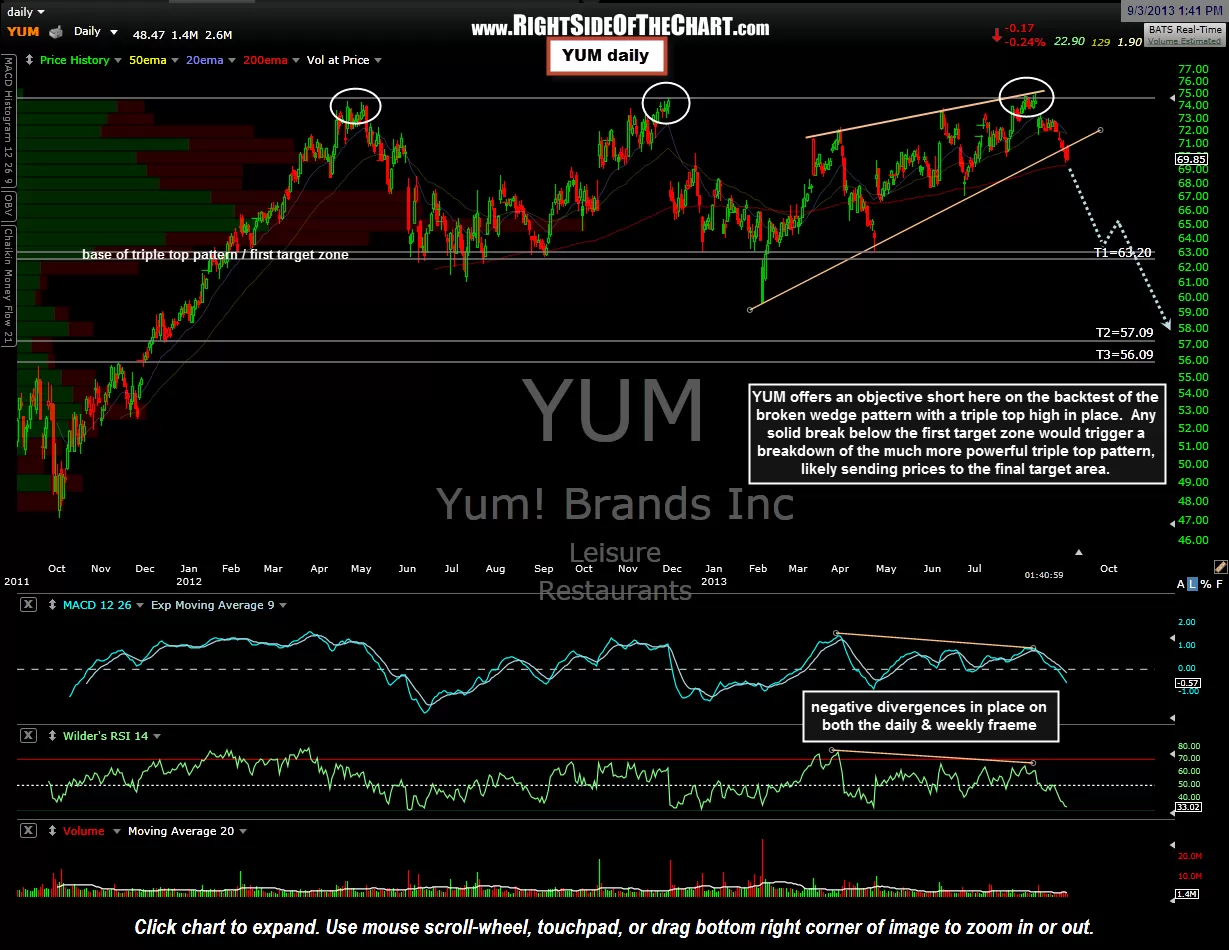
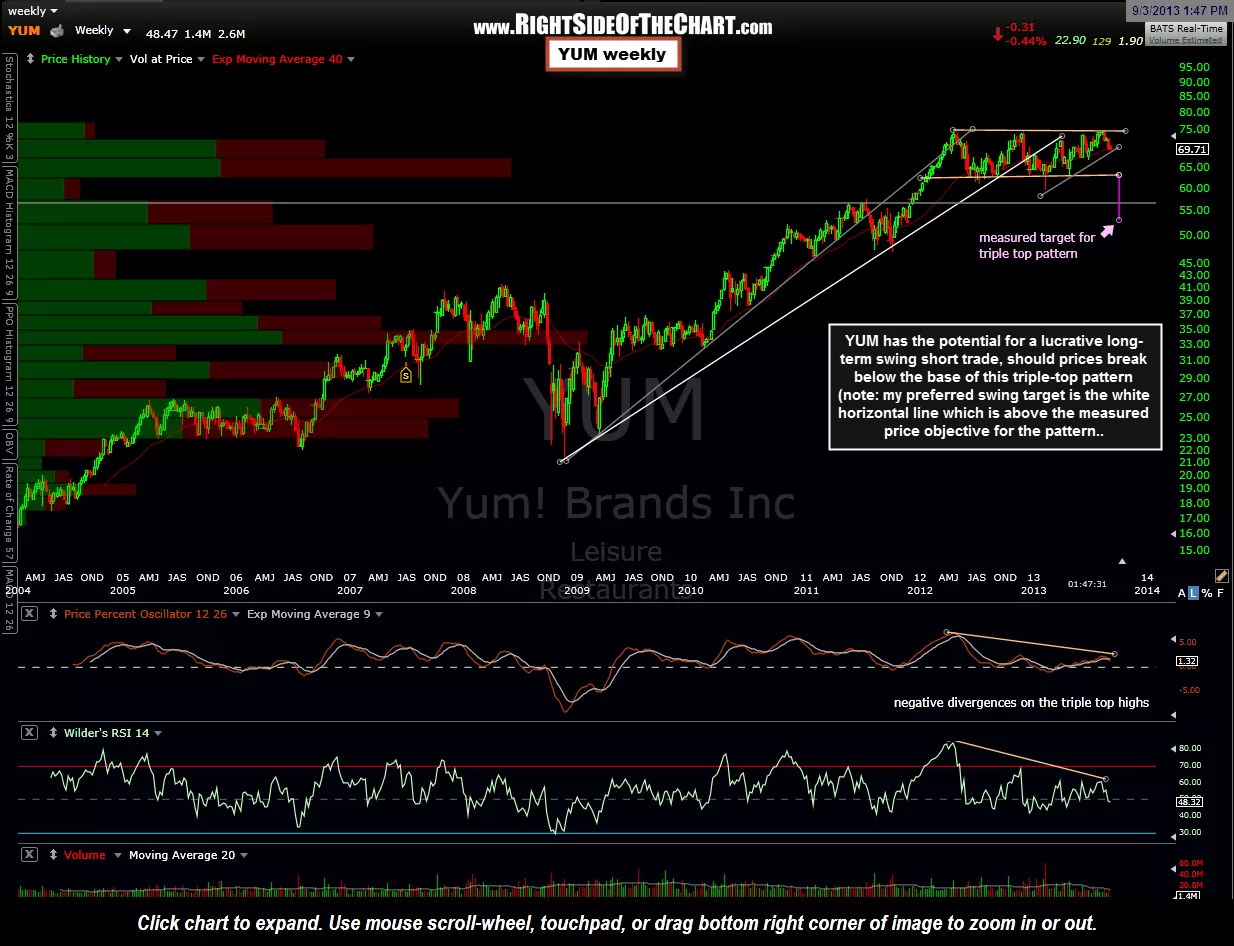
My plan is to establish a full position here with the intention of covering at the first target (T1 @ 63.20) which is the upper-end of a support range that defines the base of the larger, potentially more powerful triple-top pattern. If & when prices break below the base of the pattern, I will likely re-enter for a swing trade down to the second or final target (T3). Daily & weekly charts above.