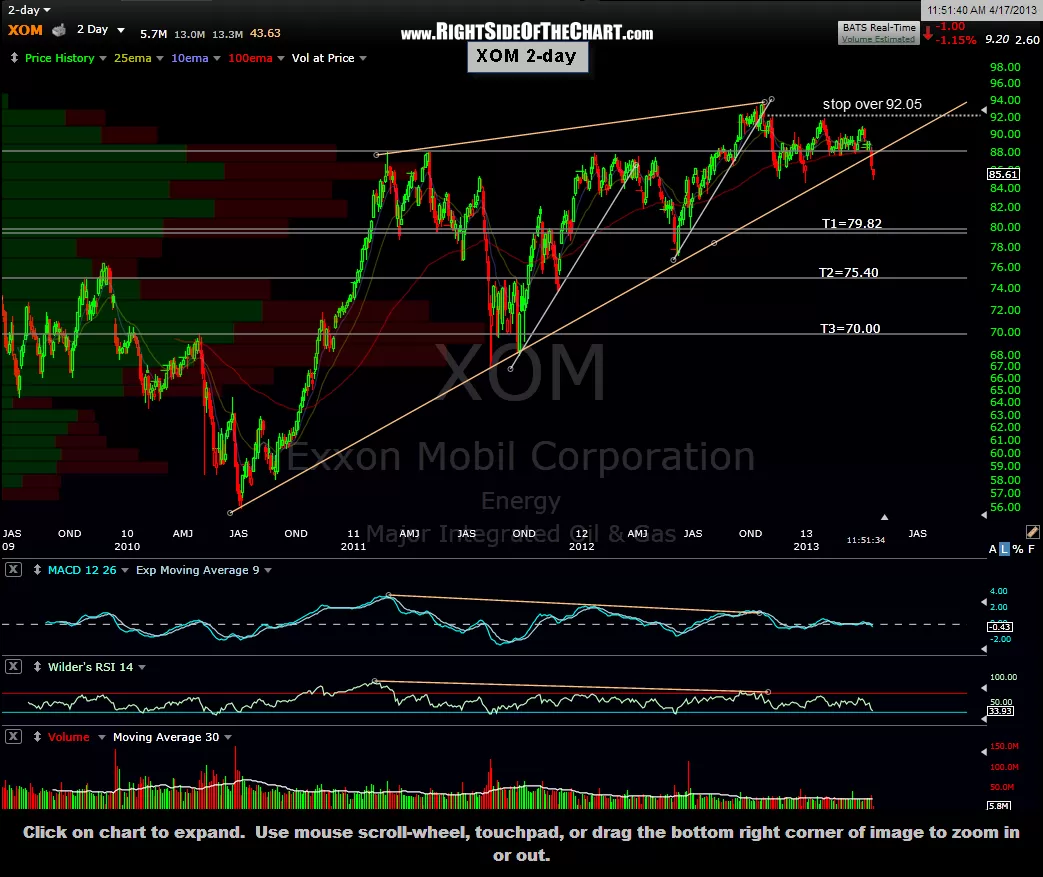
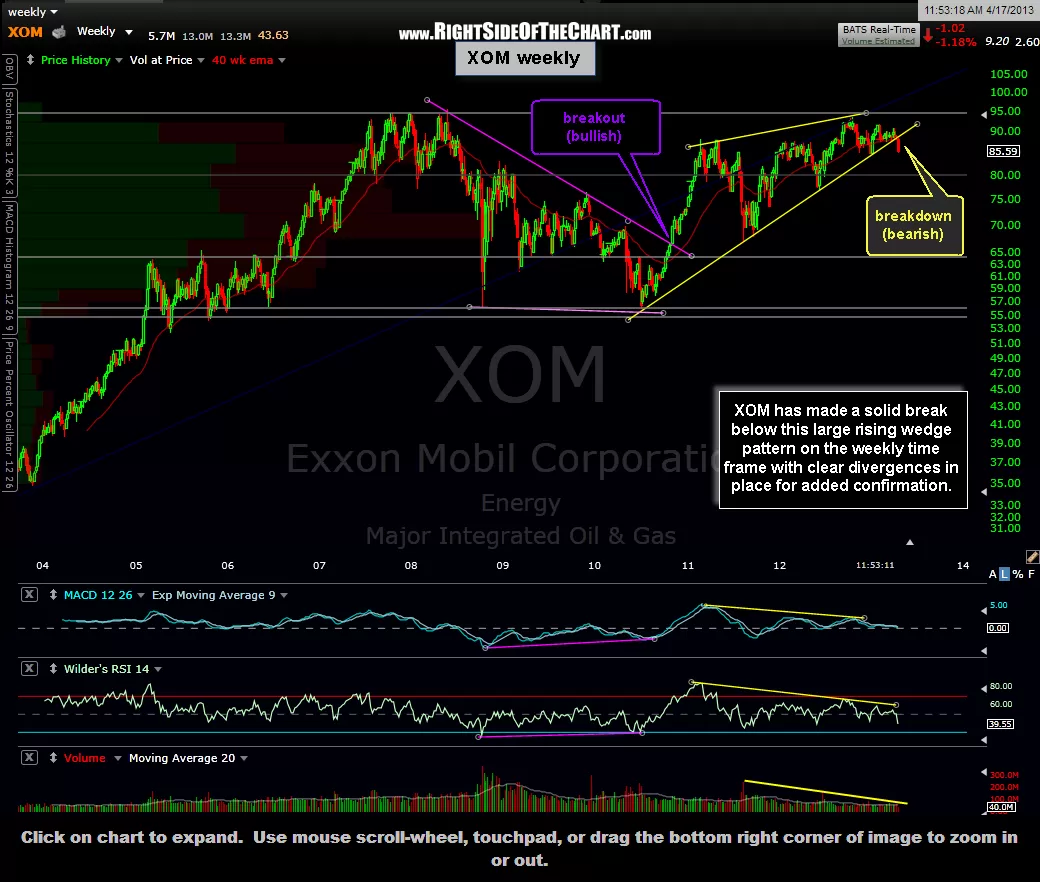
I am adding XOM, which was listed as a short setup about a week ago, as an active trade here at 85.61. In the previous post, I had pointed out this very prominent bearish rising wedge pattern on the weekly chart and suggested to wait to see a weekly close below the pattern before establishing a short position, as to help avoid the all-to-common false breakdowns that we’ve seen over the last few months. However, upon further review of the XOM charts as well taking into account the bearish technicals on nearly all US & global indices, I have decided to go ahead and add XOM as a short trade now in order to help assure what will most likely be a favorable entry price should the market sell off sharply between now & the close on Friday.
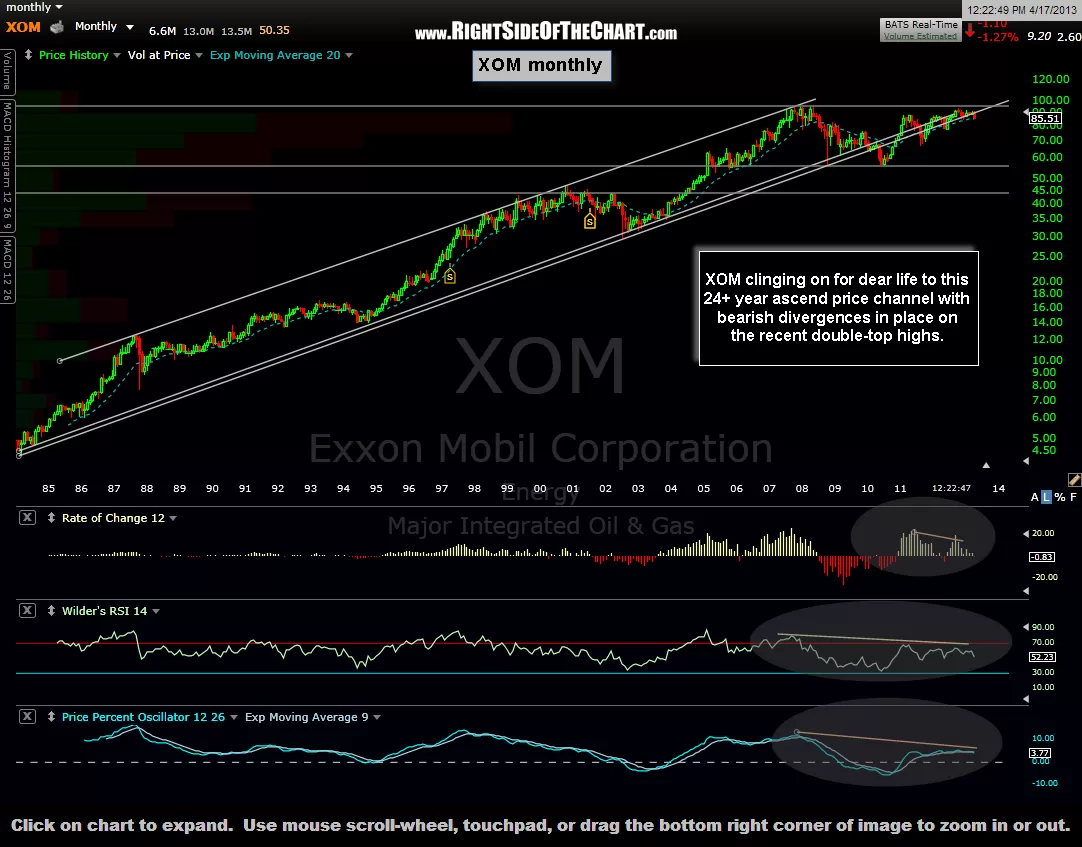
I have listed the prices targets and suggested stop level on the 2-day period chart below and have included an updated weekly chart, showing that prices are now well enough below the wedge to assume that a weekly (end of day Friday) breakdown is likely. Remember, XOM is the largest (sometimes 2nd largest as it plays leap-frog with AAPL) company by market cap as well as the largest weighted component of the S&P500. As the month chart below show, in 2010 XOM broke below a multi-decade ascending price channel that dates all the way back to 1985. In the fed induced euphoria following that breakdown, “The King” managed to briefly regain that channel but has since been clinging to the bottom of it the way a drunk driver hugs the white line on the side of the road (just before he drives into a ditch). 2-day, weekly, & monthly charts below: