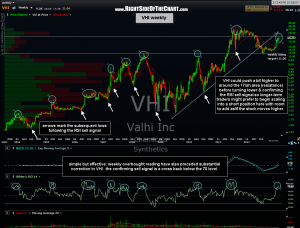
 VHI was a text-book short trade which hit it’s third and final target to nearly the penny for a 41.3% gain 7 months ago before reversing trend and climbing all the way back to just below the former first target (now resistance). There are actually several reasons for re-shorting VHI at this time so let’s break the trade down on various time frames starting with the weekly chart (right). As this chart shows, every time VHI has become oversold (70+ readings on the weekly RSI), a correction in the stock immediate followed. Keep in mind this chart shows 10 years of history with 8 previous signals (still awaiting the confirming cross below 70 for this current, 9th signal) with a 100% accuracy rate.
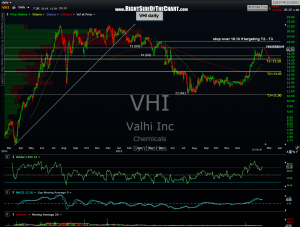
 This next chart is the daily time frame which shows the previous targets (in white) along with the current targets (yellow). Note that VHI is still somewhat below the 17.00ish resistance level so my plan is to begin scaling into a short position here, continuing to add up to as high as 17.00, should the stock continue higher but also adding if the stock begins to turn down before then. As far as the preferred target, I’m split between T2 & T3 at this time so might take 1/2 profit if/when T2 is hit and target T3 with the remainder. That will depend largely on the trend of the broad market at the time, assuming VHI gets there. As such, I’m allowing for a relatively wide stop over the 18.10 level.
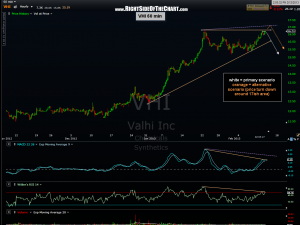
 Zooming down to the 60 minute time frame we can see that the MACD and RSI are lagging (negative divergence) as VHI challenges it’s previous highs. I could easily see prices take out those highs, sucking in some more longs and blowing out the last of any remaining shorts (which would give this trade some long-term traction) as shown on the alternative scenario. The string of charts from the previous VHI short trade can be viewed by clicking here. Note: VHI is a relatively thin stock. Therefore, limit orders are preferable over market orders due to the relatively large spread this stock has at times.

