
IWM (the Russell 2000 Index tracking ETF) as well as TWM (2x short Russell 2000 ETF) will be added as active trades here around current levels. This is an aggressive, counter-trend trade as not only is IWM still with a very powerful uptrend but prices are also still within the bearish rising wedge pattern and have yet to break down. Therefore, aggressive traders could establish a full or partial position here, waiting for a confirmed break below the rising wedge pattern before adding to the position while more conventional traders might prefer to wait for prices to break below the rising wedge pattern before initiating a short position. Targets are listed on this updated daily chart with a suggested stop somewhat above the 111 area or lower, depending on one’s specific entry price level(s). I have also put together this 10 minute video with a more in-depth analysis of IWM on both the weekly and daily time frames.
Note: TWM has been added along with IWM as a proxy for shorting the Russell 2000 index for two reasons: 1) For aggressive traders preferring to use leverage as this is a broad index short trade and 2) A vehicle to provide either a raw short as well as a possible hedge to a portfolio of long positions within tax-deferred accounts, such as IRA’s, that do not offer the ability to short stocks or ETFs. RWM is the 1x short (non-leveraged) tracking ETF for the $RUT which is another option that might be more suitable for those planning a short trade on the index which might last for more than a couple of weeks as the leveraged ETFs are more prone to price decay over extended holding periods.
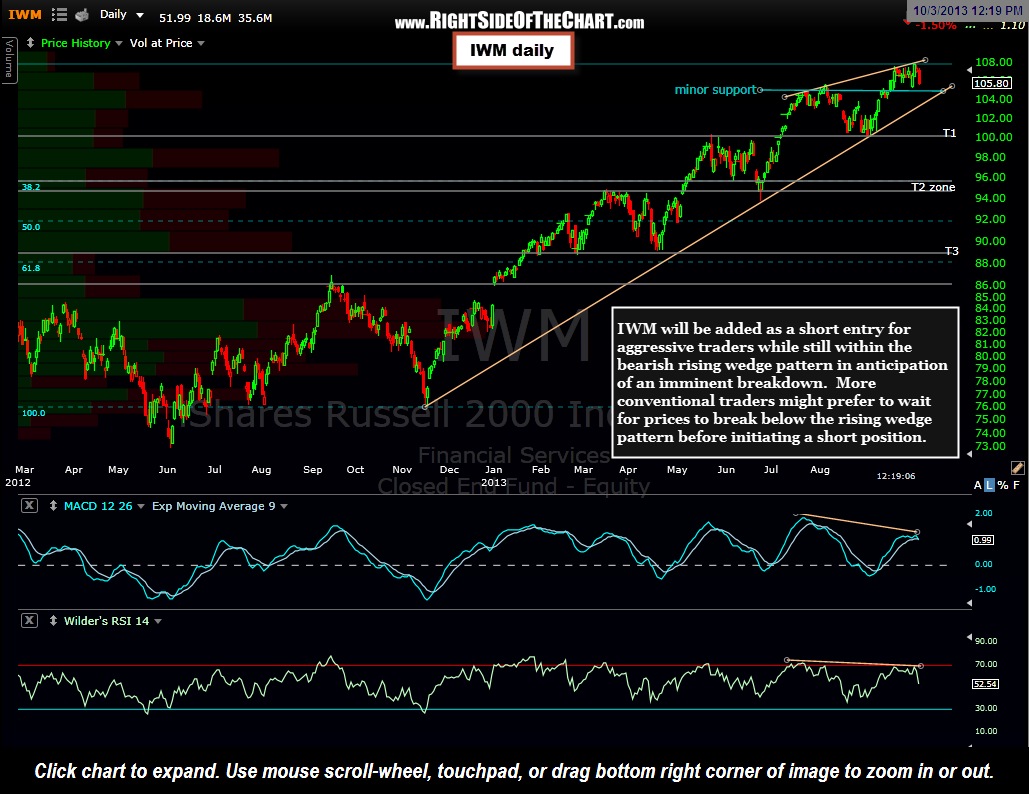
IWM Daily Chart with Price Targets