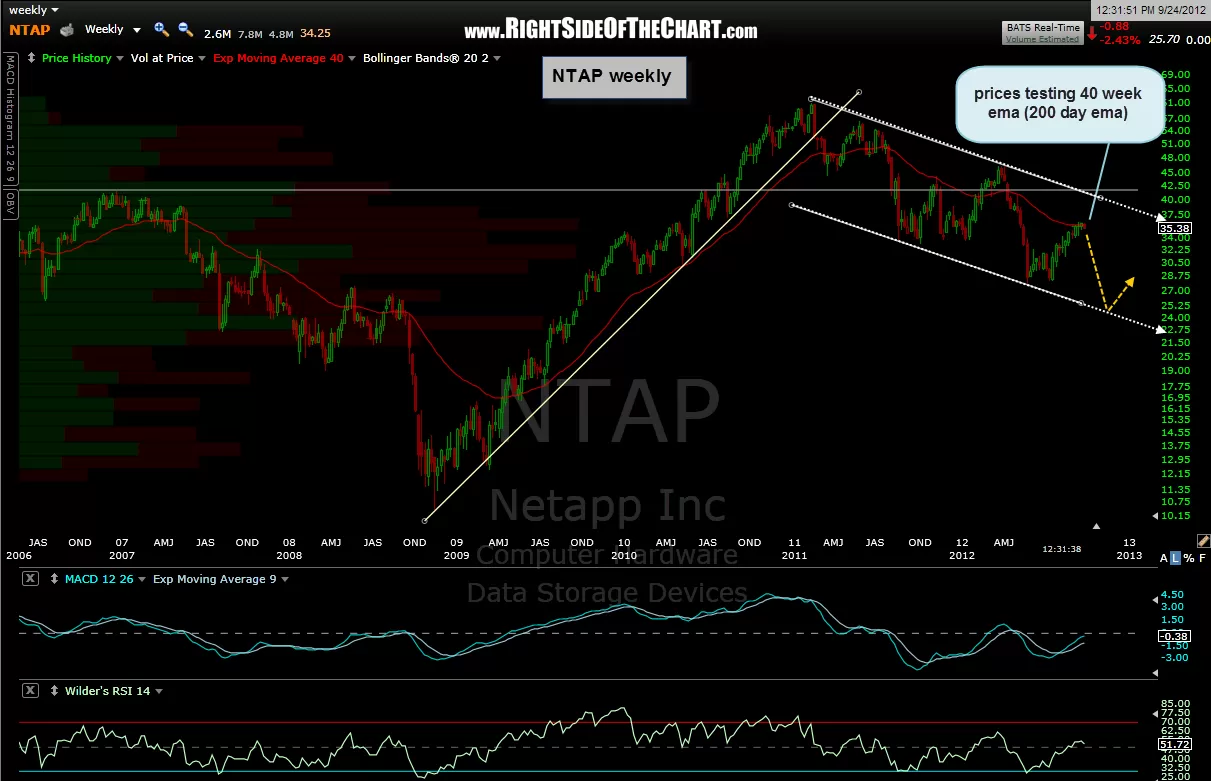
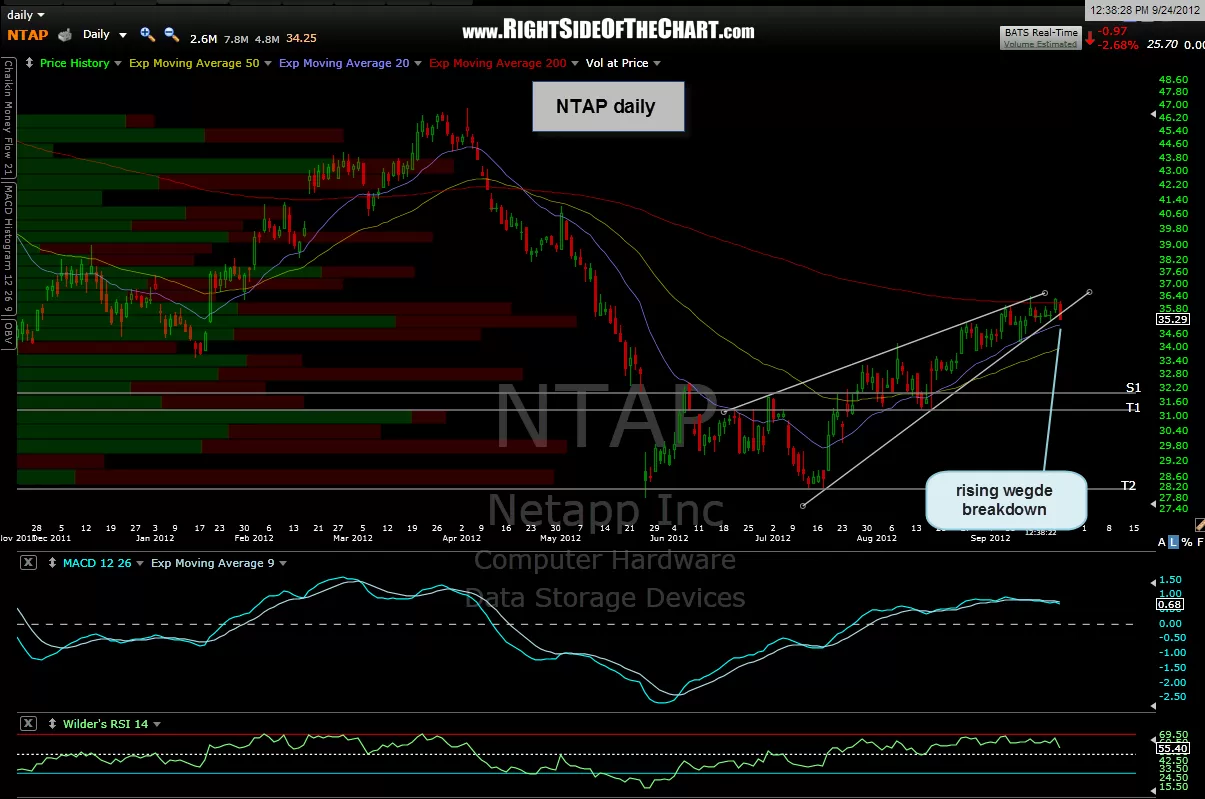
NTAP looks like an objective short entry here at 35.29 as it is breaking below this daily rising wedge. NTAP, which is clearly in a downtrend as shown by the descending channel on this weekly chart, has most likely completed an over-extended counter-trend bounce which was stopped cold by the 200-day ema (40-week ema), which has acted as decent support & resistance on this stock in the past. targets marked on the daily chart below with T1 at 31.30 & T2 at 28.15. an objective stop for most swing traders would be on a decent move (2-4%) above the 200ema.

Results for {phrase} ({results_count} of {results_count_total})
Displaying {results_count} results of {results_count_total}