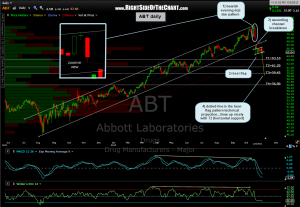
 ABT looks like something straight out of a book on technical analysis: First, prices became overbought and an extended move up within this large ascending channel with negative divergences on the MACD and RSI put in place at the recent highs. After forming a very bearish Evening Doji Star candlestick pattern around the highs (with the doji kissing the top of the channel), prices then made a large gap below the bottom of the channel. ABT went on to set up in a very clean bear-flag pattern just below the channel and a solid break below that pattern would likely spark the next wave of impulsive selling. Note how the pattern measurement for the bear-flag lines up nicely with my third target, which I had added before adding the pattern projection. Nothing is 100% in trading but from a charting perspective, it just doesn’t get much better than this.
I will consider ABT an active short at the open tomorrow unless the stock opens above today’s close of 65.04, in which case I will wait for a confirmed break below the flag pattern. Those targeting T3 might consider a stop not far above the 66.80 area while a stop slightly above the 67.60 area might be more suitable those targeting T4 (my preferred swing target).

