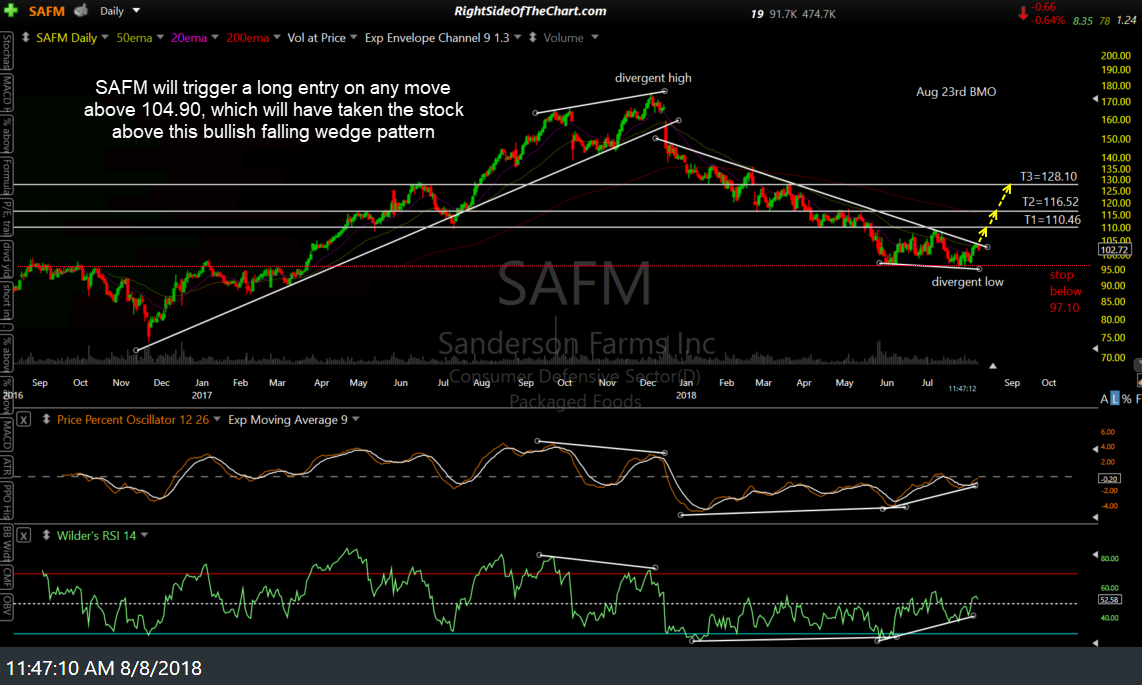
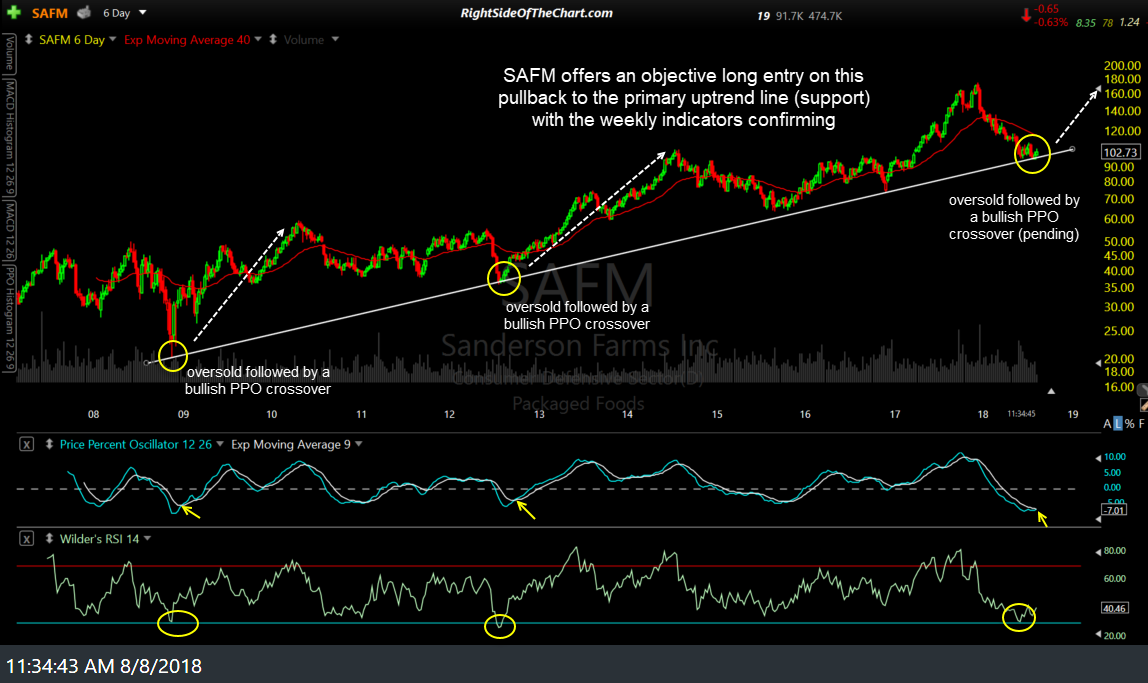
SAFM (Sanderson Farms Inc.) appears to offer an objective long entry on this pullback to the primary uptrend line (support) with the weekly indicators confirming (see weekly chart/second chart below) & will trigger an entry as both a Swing Trade as well as a Growth & Income Trade on any move above the recent high of 104.90. A move over that recent high will have taken SAFM above the bullish falling wedge/downtrend line on this daily chart & ideally, you want to see such a breakout occur on above-average volume (1.5x or better 60-100 day average volume).
SAFM was covered in the recent Long Swing Trade Ideas video published last week. Zooming out to the 11-year weekly (6-day period candlesticks) chart below, we can see that the correction that followed the divergent high & primary trendline break back in late 2017 has brought SAFM back down to the primary bull market trendline generated off the late 2008 lows. As with that 2008 low, which marked the start of the current bull market in this stock, as well as the 2012 reaction low which also tested the primary trendline, SAFM is once again testing that trendline while oversold (i.e.- a reading of 30 or less on the RSI) with a pending bullish crossover on the PPO to boot.
It should also be noted that Sanderson Farms is scheduled to report earnings on August 23rd before the market opens & as always, holding a position into earnings runs an increased risk of a gap for or against your position. As such, one should decide whether or not to take and/or hold this trade over the next couple of weeks, should a breakout occur before then.
Once again, this is only a Trade Setup at this time with an entry to come on a break above 104.90. The price targets for this trade are T1 at 110.46, T2 at 116.52 & T3 at 128.10. The suggested stop, based on the final target, is any move below 97.10 with a suggested beta-adjusted position size of 1.0.


