On March 22nd, I posted the top 10 largest components of the Russell 2000 Index ($RUT), making a case that of all the broadly diversified US Indices, the $RUT was by far the most bearish looking and was full of “screamingly bearish patterns”. Since that time, the $RUT has fallen despite the fact that every other diversified index (The Dow Industrials, S&P 500, S&P Mid-Cap, Nasdaq 100, Nasdaq Composite, etc..) has gained in value since then.
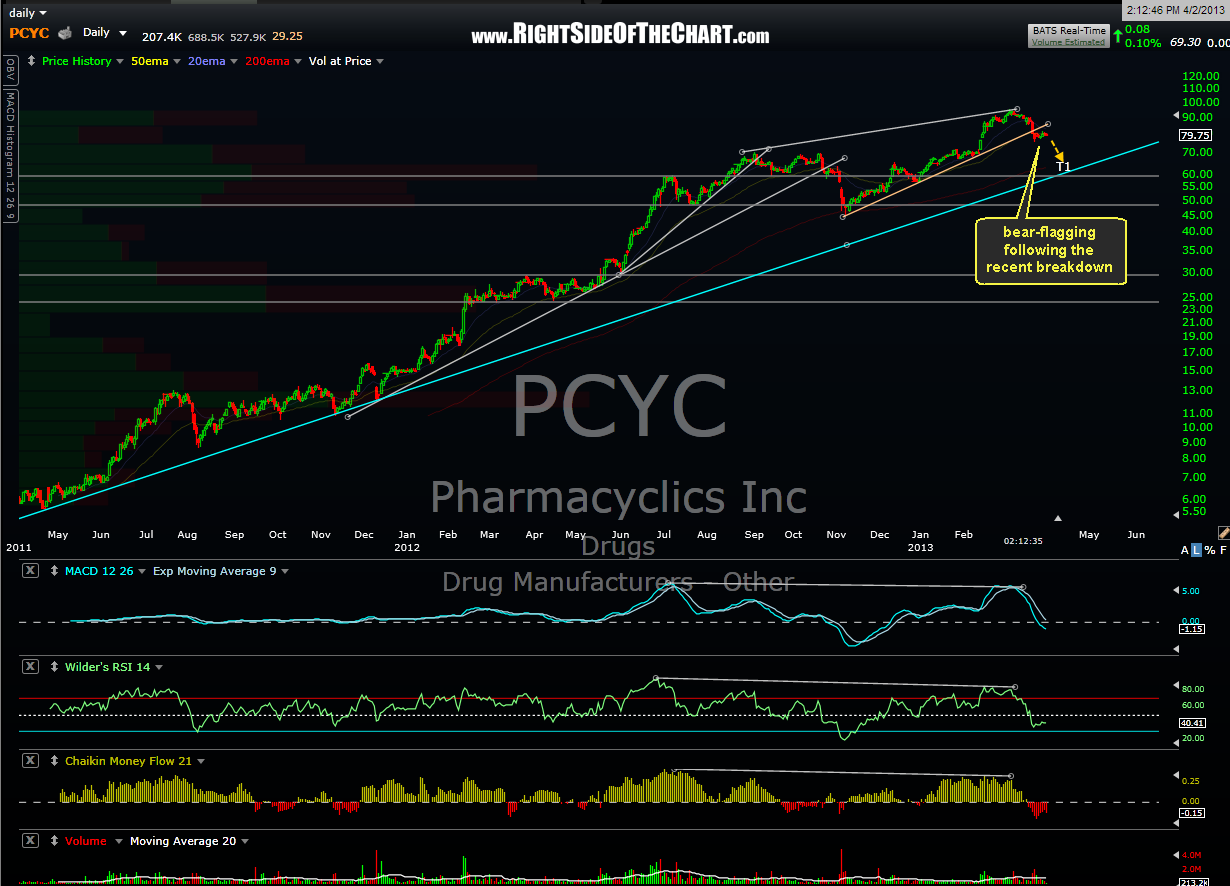
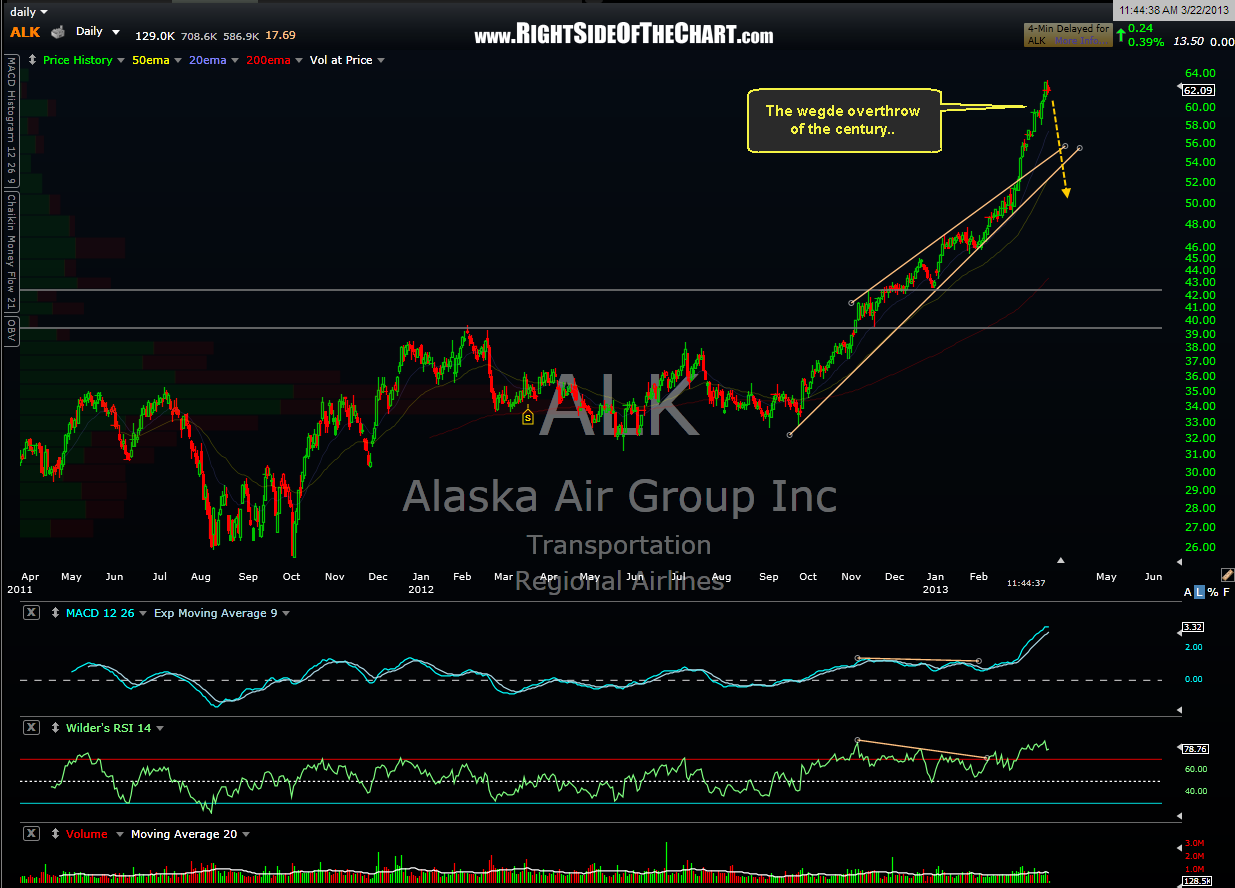
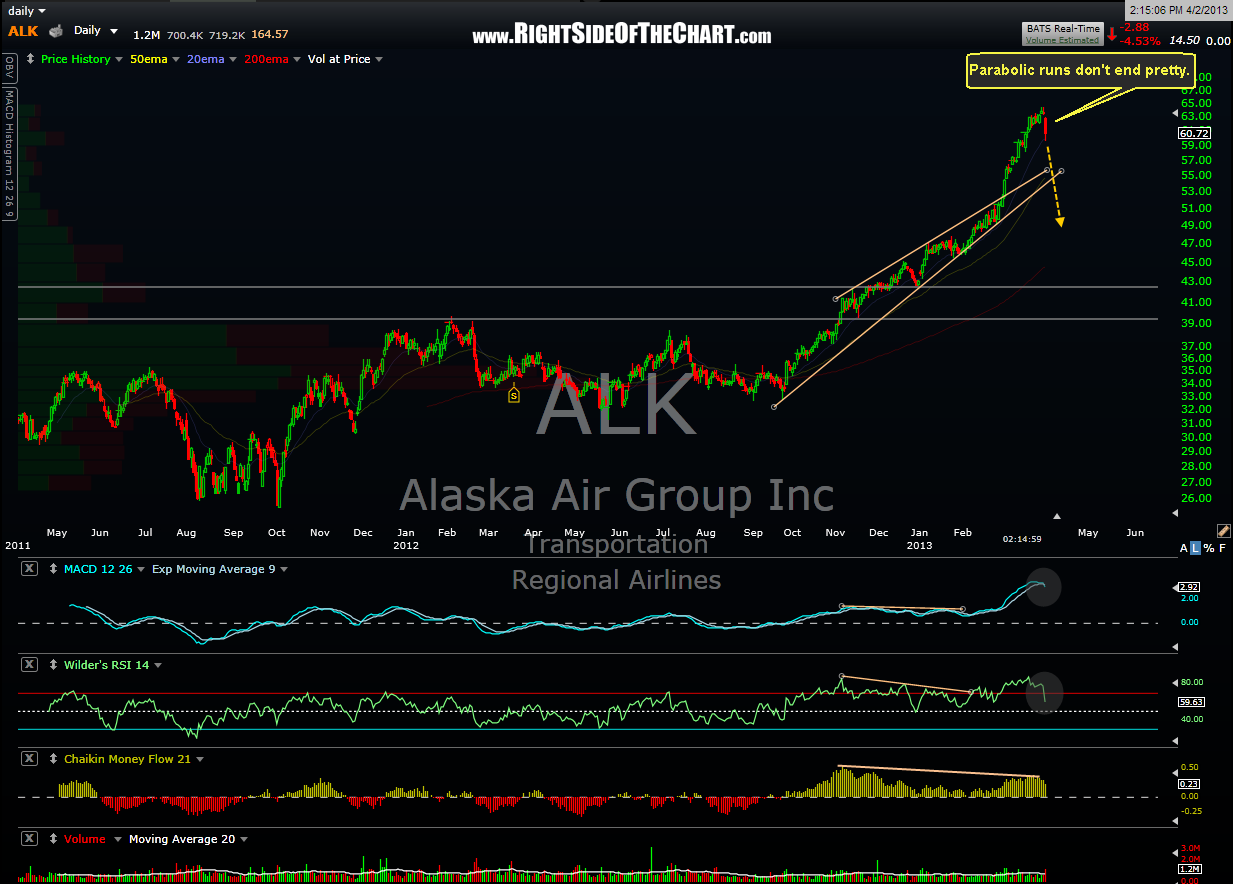
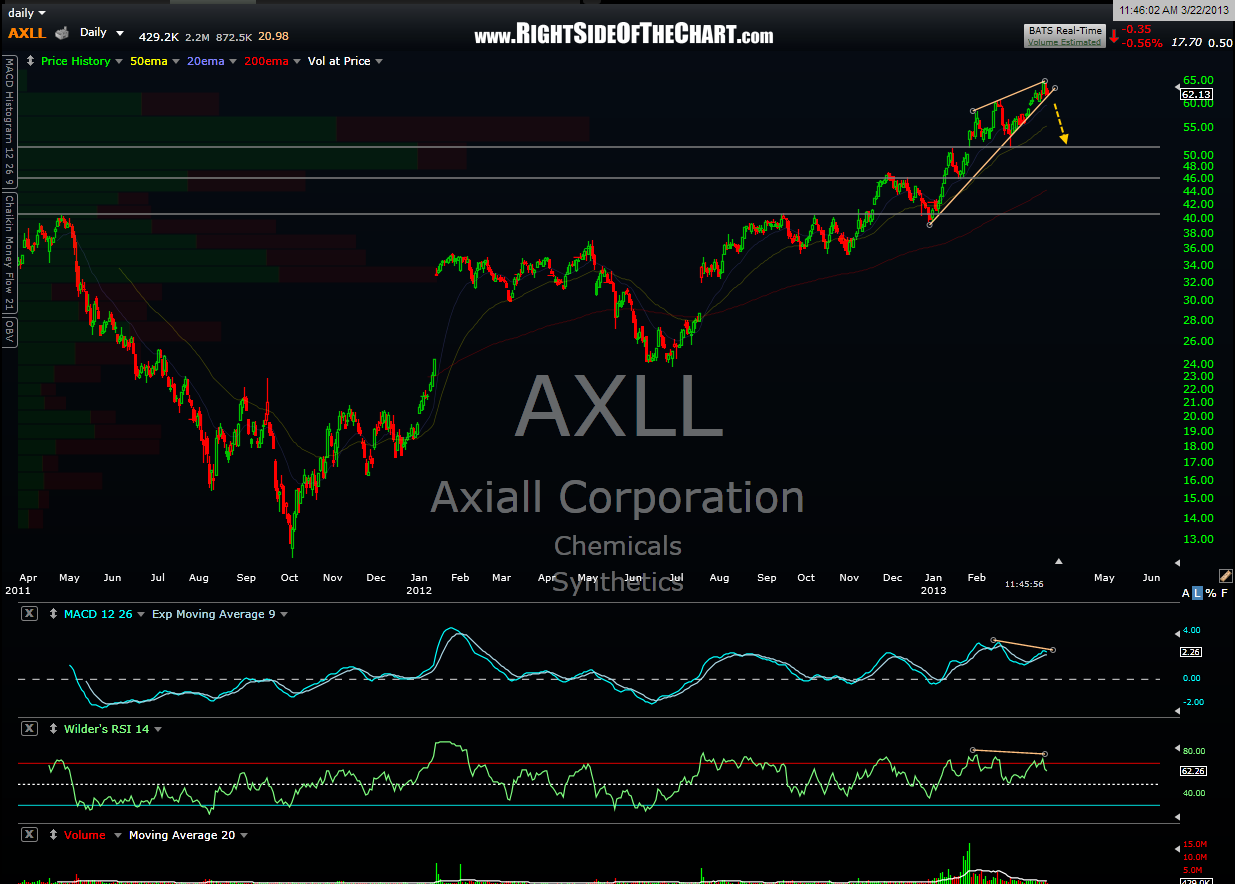
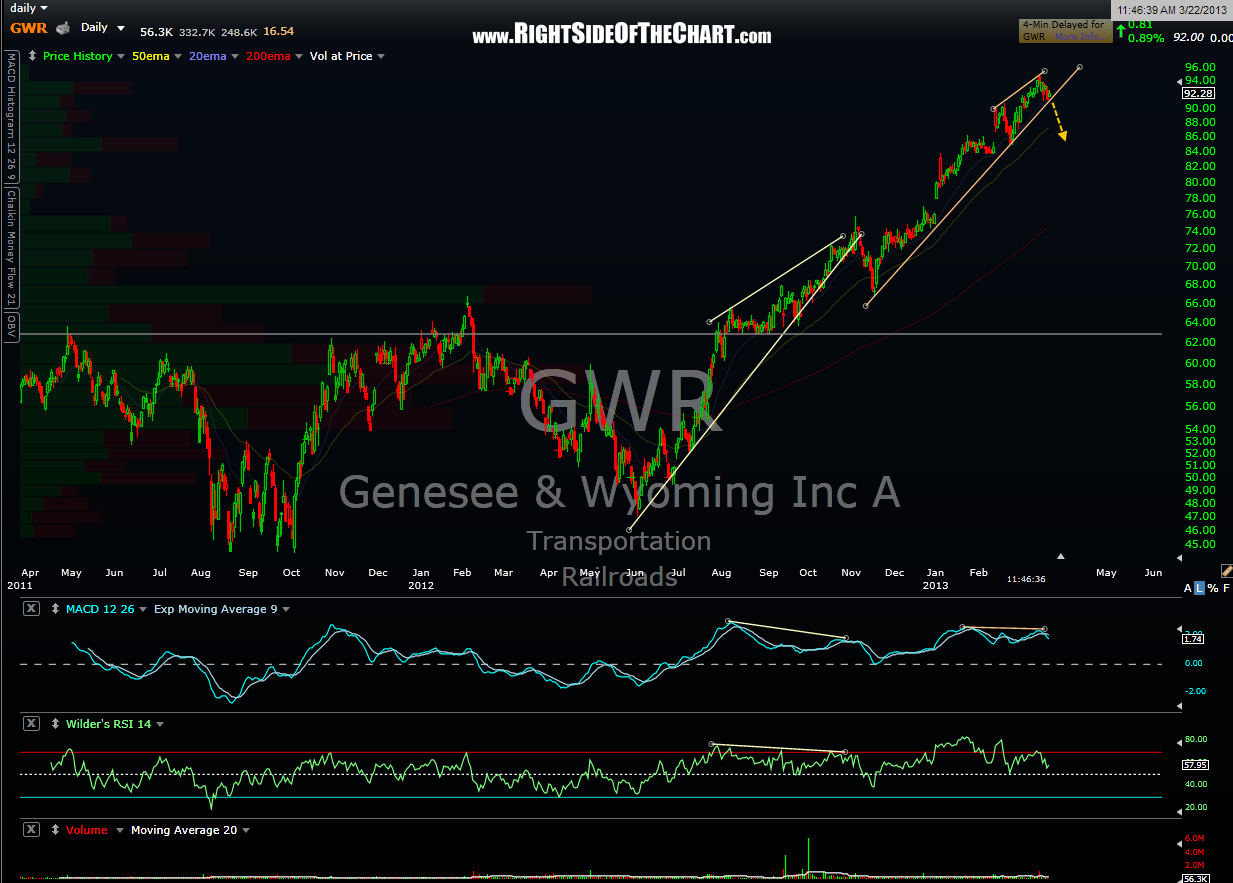
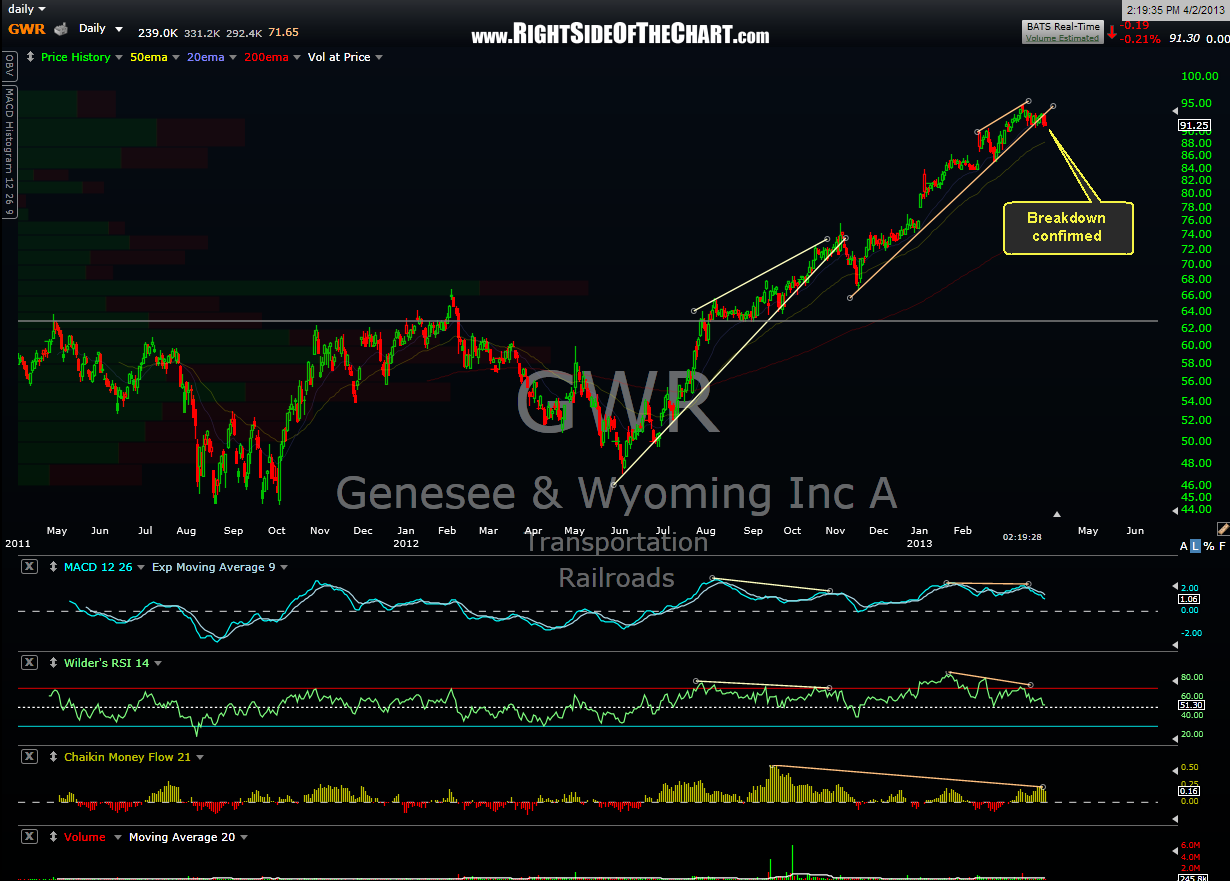
I just want to reiterate that I still believe that the $RUT (via IWM, TWM or TZA, depending on your preference for leverage) offers a very good R/R short entry around current levels and will most likely lead the way on the downside, if when a decent correction in the US equity markets gets underway, which has most likely already begun with the $RUT leading the way. With that, here are the daily charts of the first 5 of those top 10 components from that March 22nd post showing the previous chart followed by today’s updated chart. Basically, I had showed most of those stocks still rising within bearish patterns at the time and as these updated charts illustrate, most have now clearly broken down, triggering very solid sell signals. The charts of the remaining top $RUT components will follow soon.