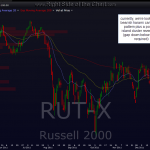
i haven’t made many index charts or commentary lately because technically speaking, not much has changed in the last week or so other than prices moving just slightly above key resistance levels on suspiciously low volume with slowing momentum. here’s a quick look at the $RUT showing not only a clear bearish harami candlestick pattern (followed with a text-book doji today) but also, like most key indices right now, the potential to put in an island cluster reversal topping pattern… gap down needed, of course.
until, and even after, we finally get confirmation or early signs of a trend reversal or pullback, i will continue to post the most attractive long and short set-ups that i can find. please remember the goal of this site is first and foremost, to provide timely, actionable trade ideas with clear entry and exit criteria and secondarily to share my thoughts and analysis on the markets. it has been my belief, and experience for quite some time that there is an abundance of market analysis out there, some good, some not so good, with nobody even close to being right all the time, myself included. to those solely trading index derivatives (futures, etf’s, options, etc..), your analysis of the market is critical to your performance (and success); to a stock trader who is able to focus most of their efforts in successfully trading the best looking patterns and set-ups on individual stocks, regardless of the fluctuations in the broad markets, i believe you stand a much better chance of success, even if all of your trades are not always in alignment with the current trend. with that being said, of course it makes sailing much easier when the wind is to your back and as such, i always prefer to align my trades with the prevailing trend unless that trend is unclear (e.g.-a choppy/consolidating market) or there is enough supporting evidence in place to indicate that the odds for a very sudden and potentially large counter-trend move are elevated to the level where the reward of holding only positions aligned with that trend does not outweigh the potential risks (e.g.- large gap down that blows right past your stops or another mini-crash scenario). yes folks, the odds for that to happen are very low at any point in time, including right now. however, those same odds are also many times higher currently than just about another other time in a while, IMHO. again, it’s all about the risk vs. reward. basically ask yourself: will the market go up another 15% before dropping 5% first? if you feel strongly the answer is yes, then you should be mostly/all long. if not, then you might consider either trading hedged (long/short), tightening up stops on your existing positions or being mostly in cash (or day-trading for those experienced in doing so). ok, enough rambling…here’s that $RUT daily chart.


