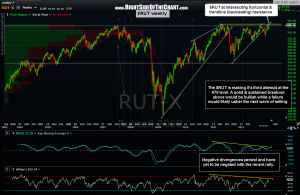
 As discussed in the recent 12/20/2012 Weekly Charts Overview Video, the $RUT is still backtesting the recently broken uptrend line and prices are now up against that key 870 resistance level which the small caps have failed to surmount on all previous attempts. From a technical perspective, obviously a break above this level would be bullish. One thorn in the Russell’s side however is that all the other “more important” indexes, such as the $SPX, $COMPQ, $NDX, $DJIA, etc.. are still well below their previous highs which will most likely provide formidable resistance if & when prices test those levels. As with the $RUT weekly chart below, the negative divergences on those key indices remain intact for now as well. Bottom line: Bullish short-term price action against a backdrop of longer-term bearish technicals.

