
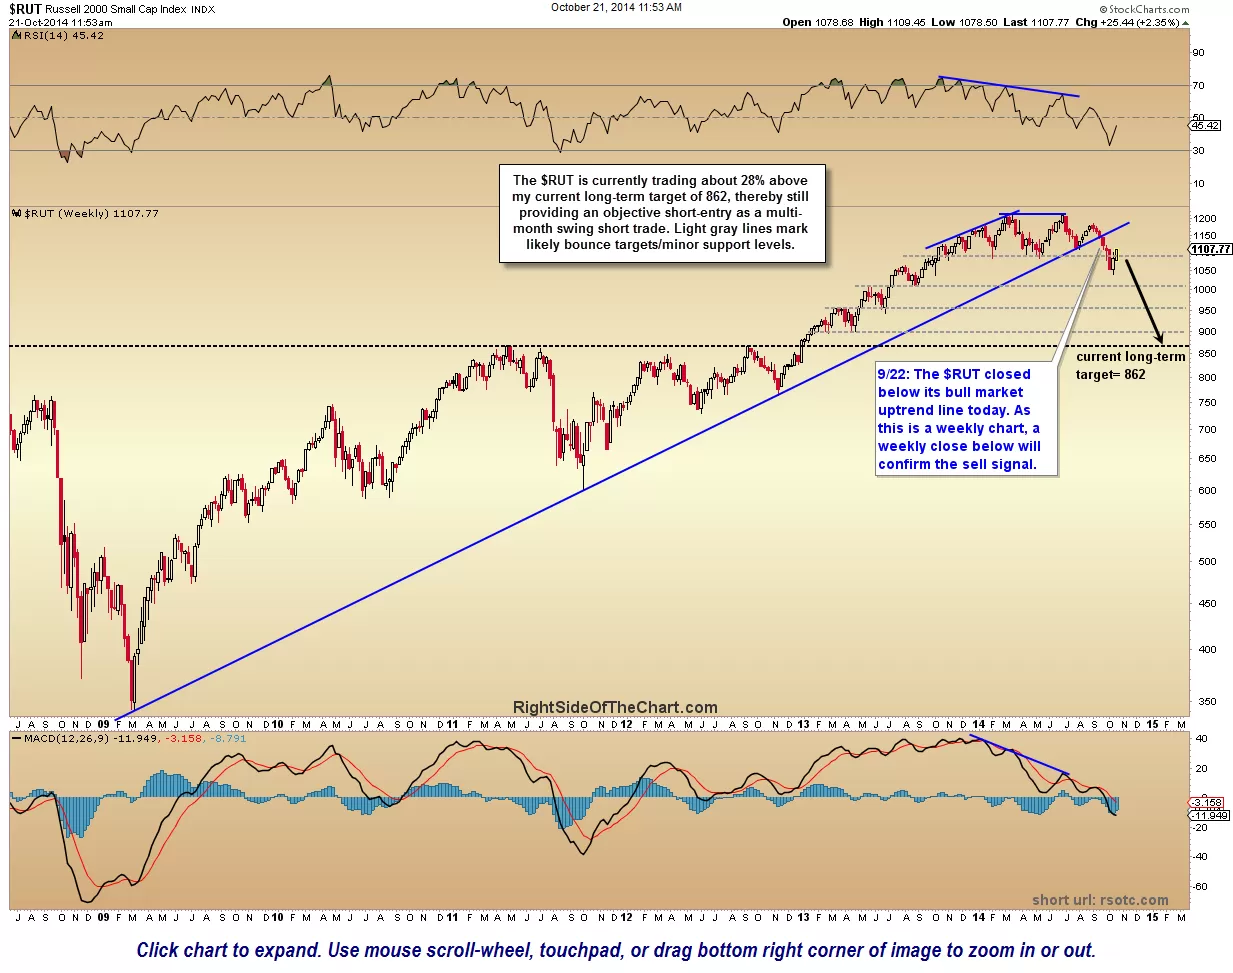
This first chart below is the weekly chart of the $RUT (Russell 2000 small cap index) with my current final downside target of 862 as well as some of the minor support levels along the way. The second chart is the update 120 minute (2 hour period) chart of the IWM ($RUT tracking etf) with the same suggested stop levels that were recently posted on this chart. The $RUT led the US indices on the way down, peaking back on July 1st, months before the $SPX, $NDX, $DJIA, etc.. and falling over 14% into last week’s lows. As would be expected, having fallen the most both in time & scope, the extremely oversold & higher-beta $RUT has been one of the leading indices the way up on the recent oversold rally since Wednesday’s lows, up about 6.5% since then. As impressive as this bounce may appear, so far (as of today’s highs), the $RUT has only retraced 38.2% of that 14% plunge off the highs… a typically minimum Fibonacci retracement or counter-trend bounce of a larger impulsive move.
-
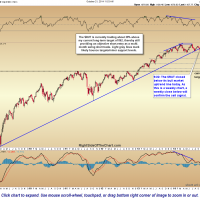
- $RUT weekly Oct 21st
-
- IWM 120 min Oct 21st
Once again, multiple targets are listed on IWM short trade that was added on Thursday to accommodate various trading styles & price targets. For those just looking to position short on this bounce with the expectation of covering on the next price target of 1010 on the daily $RUT chart, a stop no higher that the 111.10 level would be prudent. For longer-term swing traders targeting a move down to the 862 area, about 20% below where the IWM short trade was added, a stop above the 144.55 level (stop 3 on the 120 minute chart) would still provide an attractive R/R of nearly 4:1.
At this time, just about every major index that I track is still trading well below the recently broken long-term bull market uptrend lines and the intermediate-term trend, as well as all but the fastest short-term trend indicators remain on sell signals. That could certainly change should the markets continue to rally sharply but until that time, most active traders should consider shorting bounces back to resistance. Until/unless the current sell signals flip back to bullish, the odds of long-side breakouts failing before reaching the measure target of the pattern is elevated (referring to typical equities that trade in-line with the broad market).