
IWM (Russell 2000) buy signal to come on a solid break above this 60-minute downtrend line with a current maximum bounce target of the primary downtrend line off the highs.
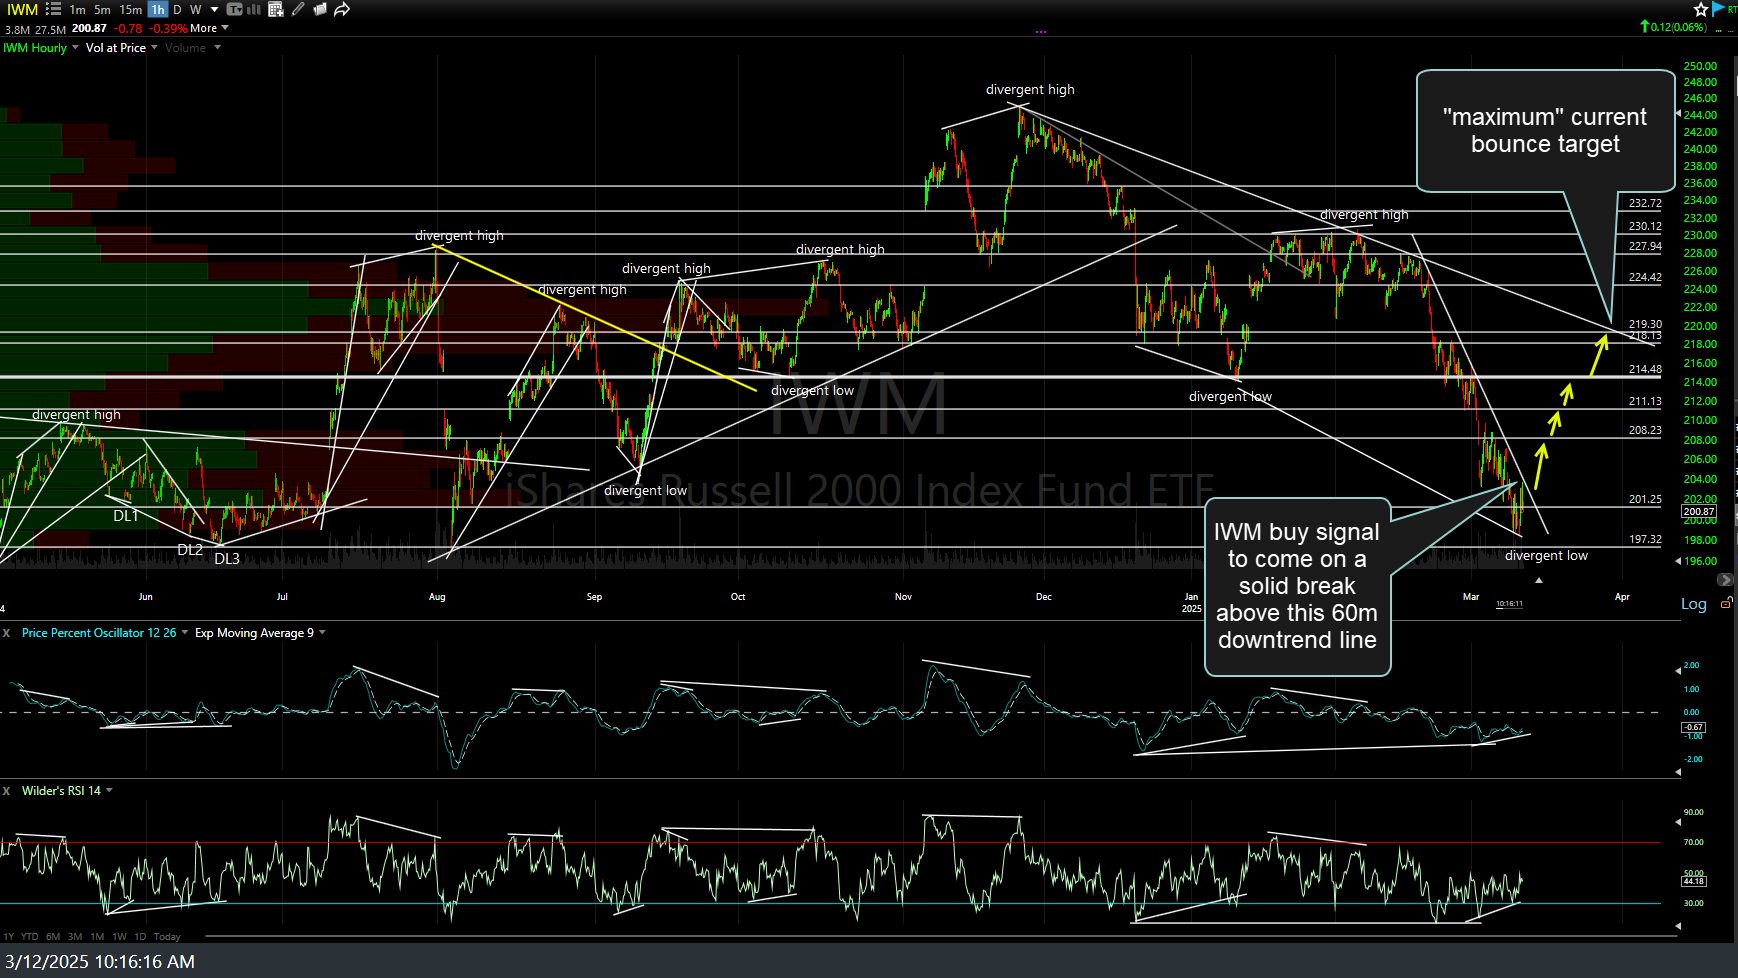
IWM 60m March 12th
Although IWM has been covered in videos many times since, the last daily chart I posted (first below) was back on Dec 18th, calling for a deeper correction when my key yellow uptrend line & nearby 226ish price support level was taken out. That was a very timely (and profitable) post as IWM went on to trigger that major sell signal that very day with a massive red candlestick down below both supports & has been good for a 14% profit from that entry so far (although we already had a previous short/sell signal on the minor trendline break just off the highs).
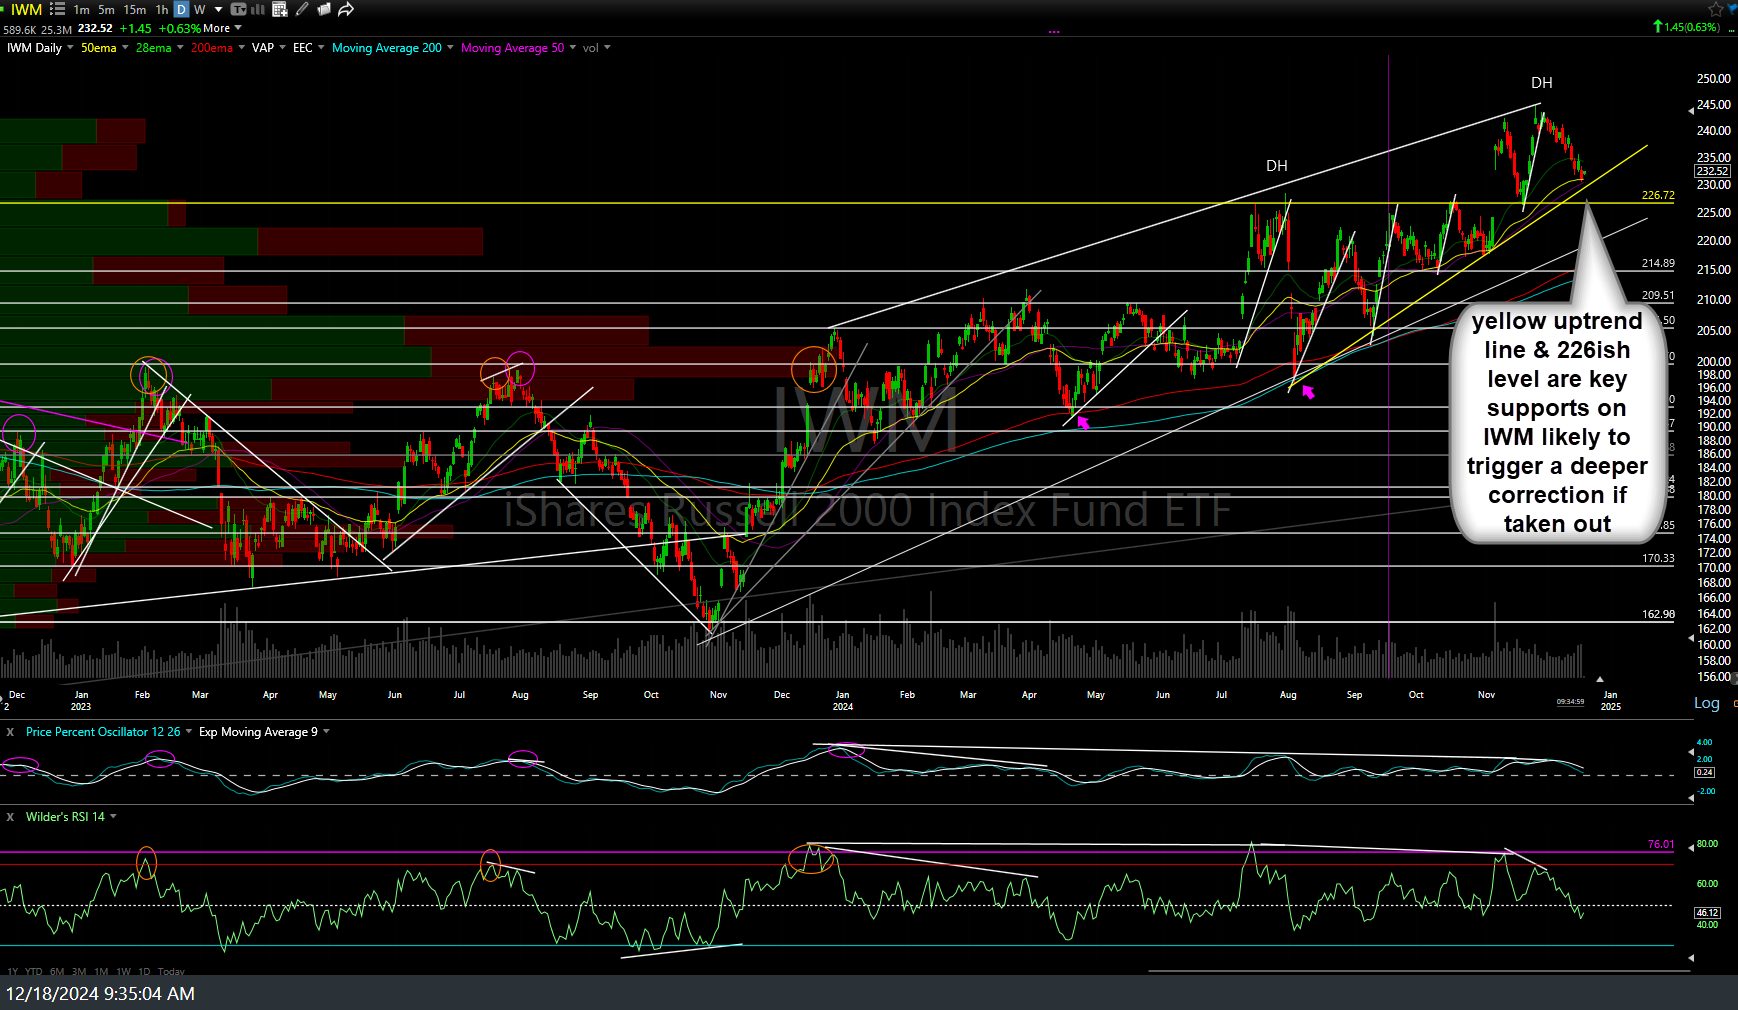
IWM daily Dec 18th
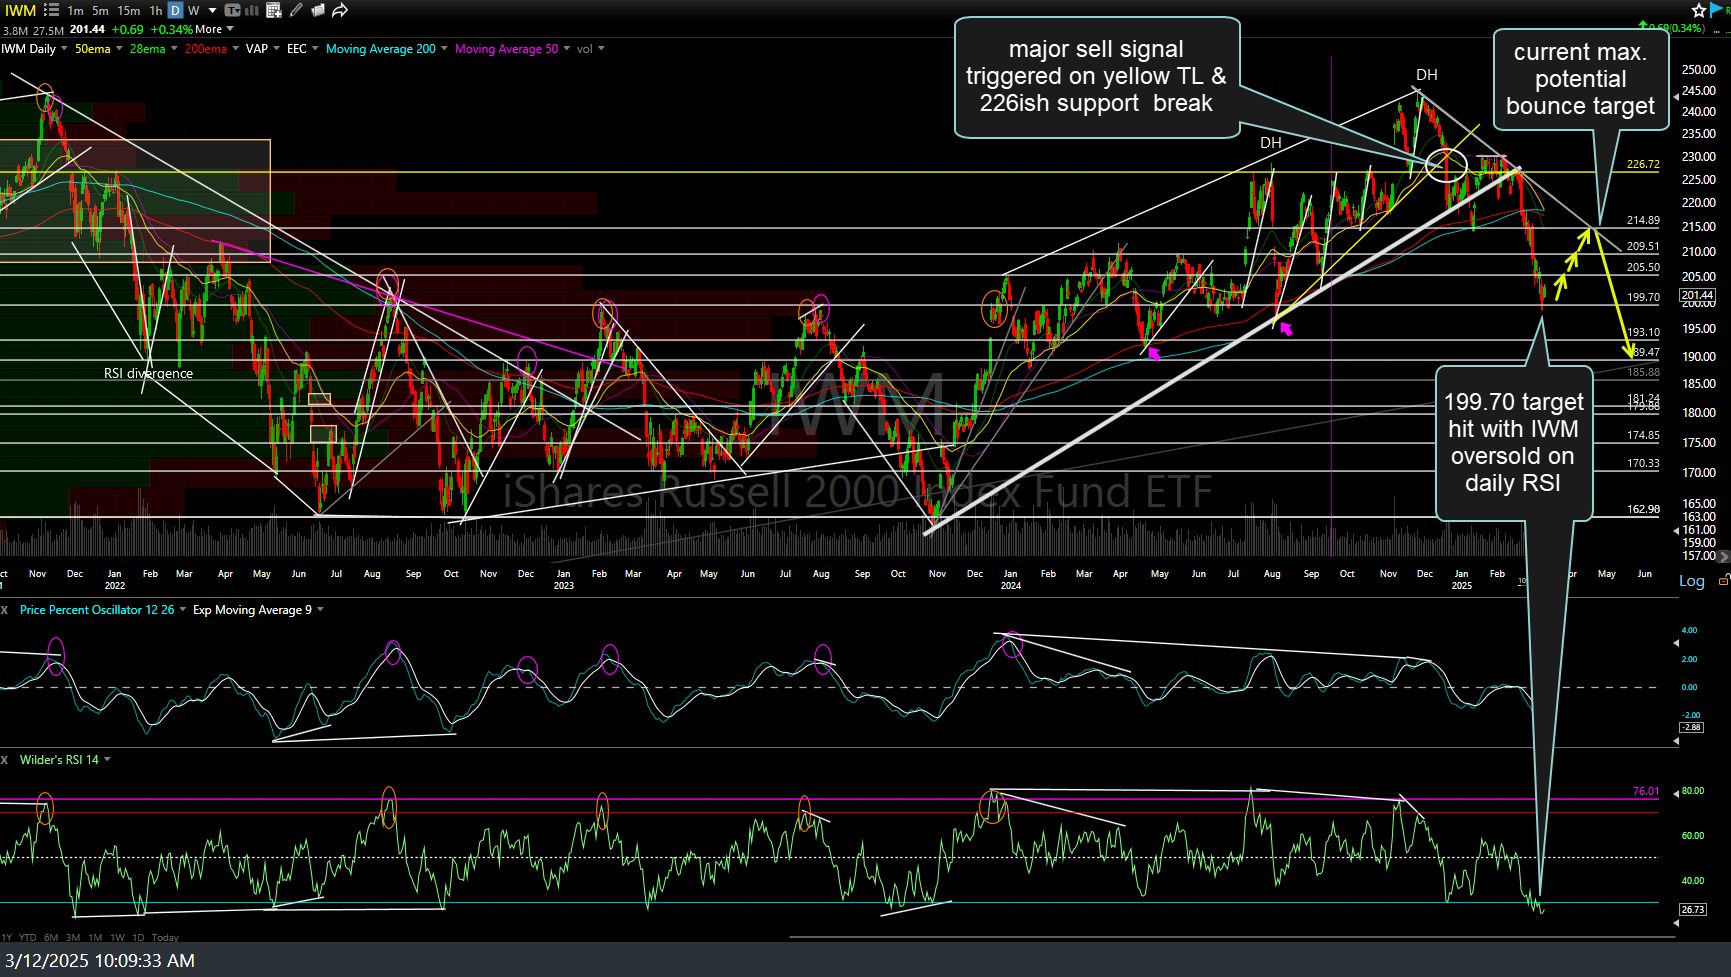
IWM daily March 12th
IWM hit my 199.70 target (the horizontal line capturing those March, June, & July ’24 reaction lows on that Dec 18th chart) yesterday & remains above it today, thereby offering an objective, yet aggressive entry, as there isn’t any decent evidence of a trend reversal yet. As such, long-term swing or trend traders still short IWM & holding out for additional downside (which I still favor in the coming months+) might opt to lower stops to protect profits at this time.
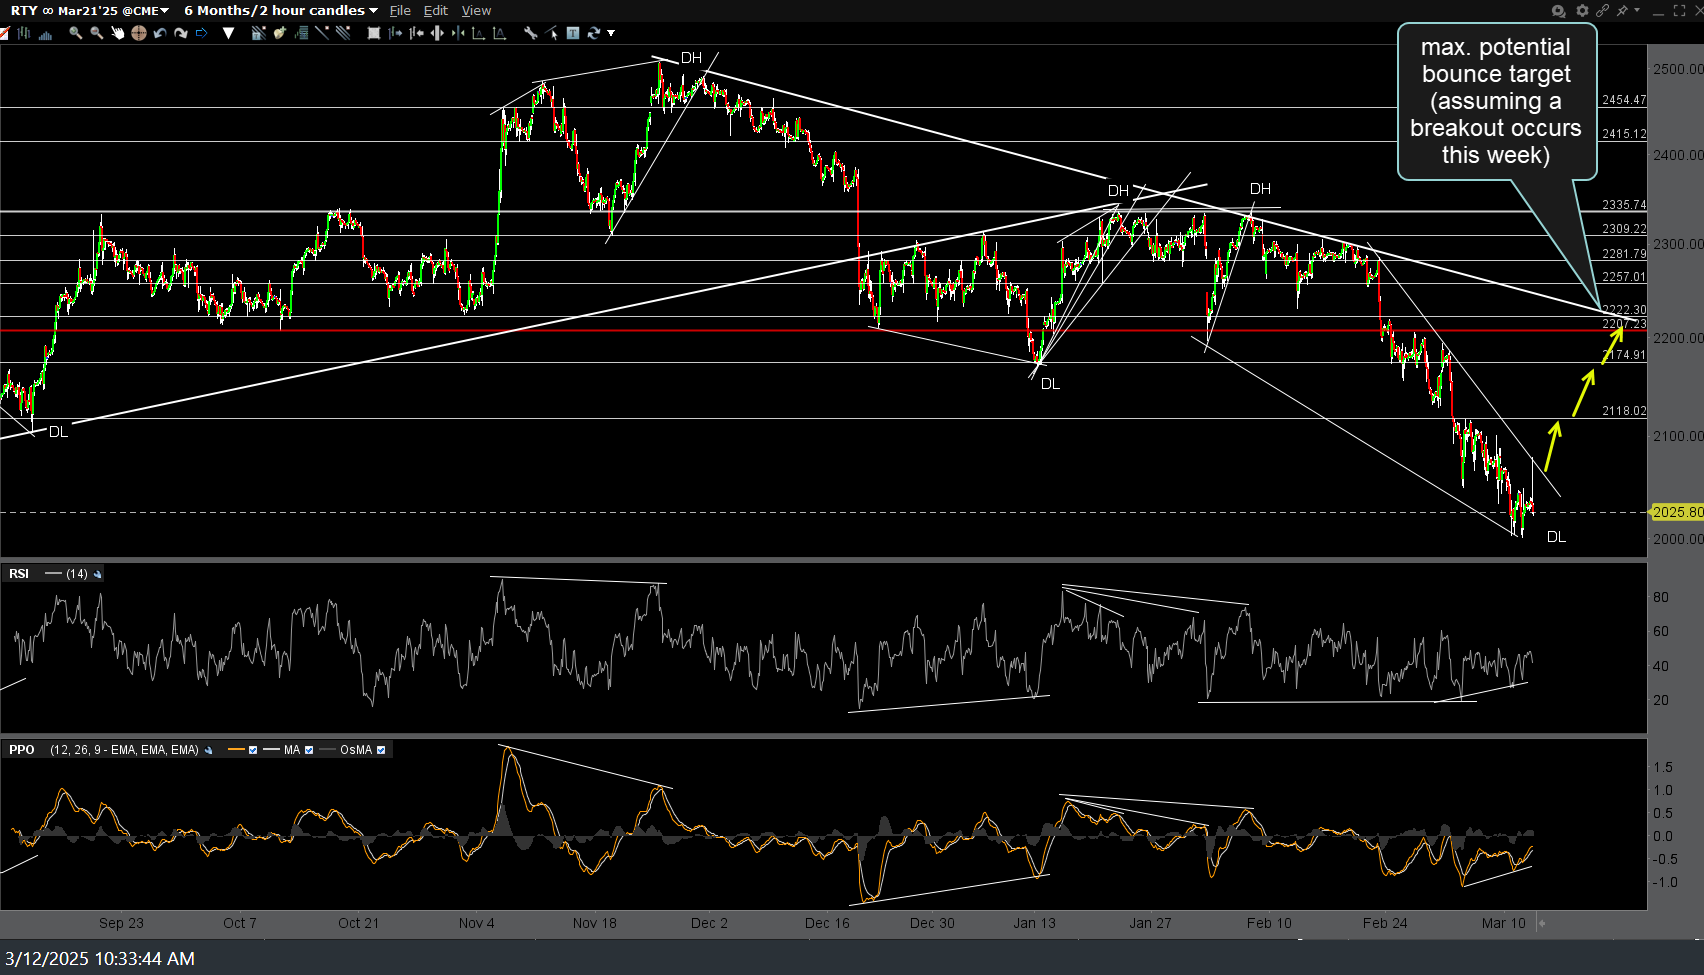
RTY 120m March 12th
More active swing traders might opt to either take a starter (partial) long position here (aggressive, as still in a powerful downtrend with no buy signals yet) and/or on a buy signal with a solid breakout above the downtrend line on the 60-minute chart at the top of this post. I’ve also included a 120-minute chart of /RTY (Russell 2000 futures) above, which will trigger a buy signal on a solid break above the bullish falling wedge & the same maximum potential bounce target of the downtrend line off the highs.