
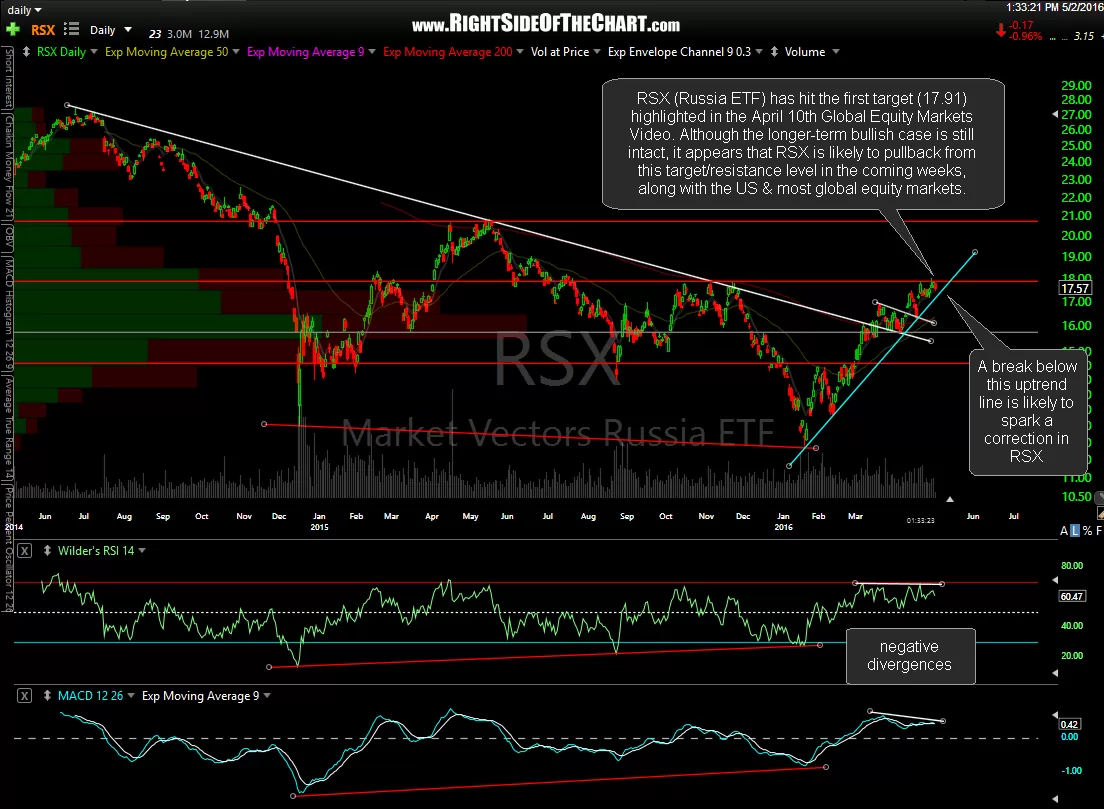
In the comments section below the recent Global Equity Markets video, member Eric K. had asked my thoughts on RSX (Russia ETF), which I had covered a few weeks early in this previous Global Stock Markets video. In that video I had laid out the bullish case for RSX on both a near-term & longer-term perspective. Since then, RSX went on to break out above the minor channel that was highlighted on the daily time frame & just recently hit my first target at the 17.91 area, gaining about 10% from where the stock was highlighted in that April 10th video .
-
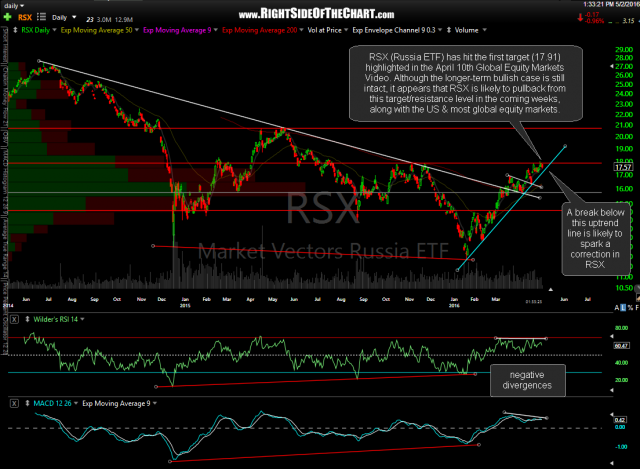
- RSX daily May 2nd
-
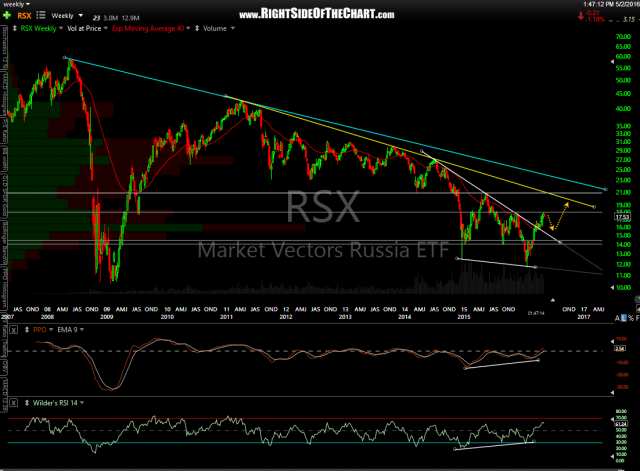
- RSX weekly May 2nd
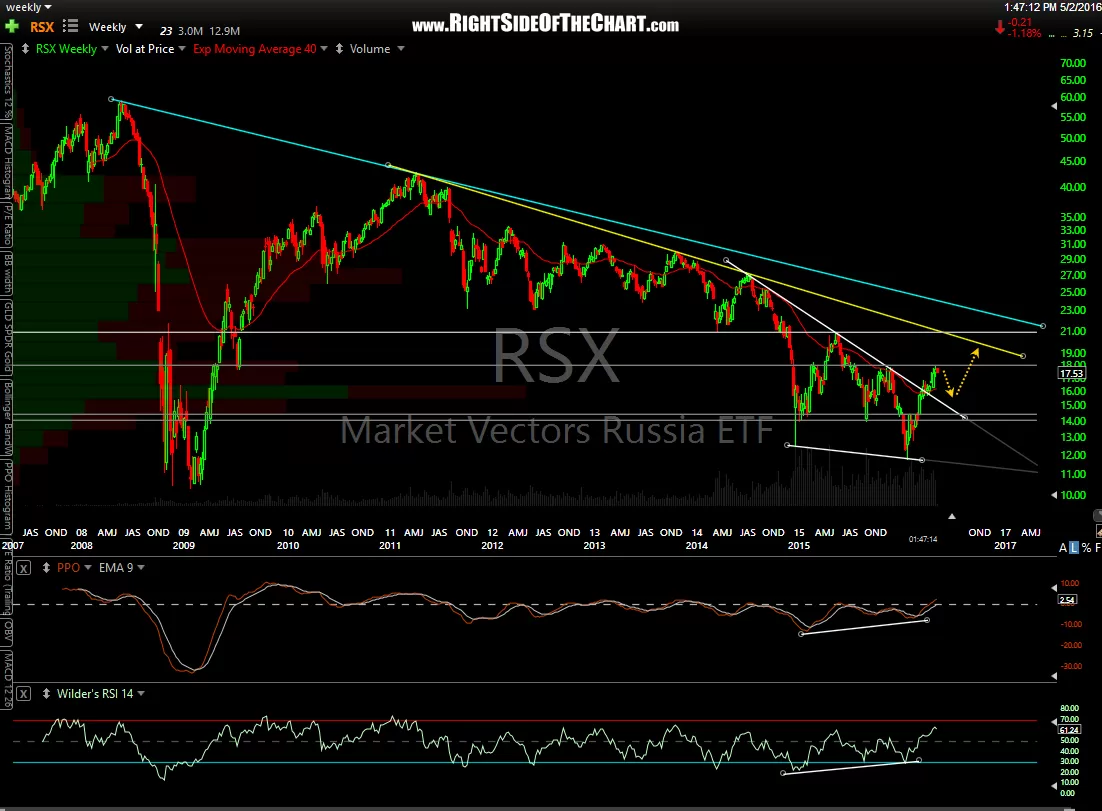
My preferred pullback target at this time would be the 15.80 horizontal support level (gray line) although I’m open to the possibility of additional downside, depending on how things develop going forward. RSX was not an official long trade idea nor is a short trade on RSX official either. Just sharing my observations & opinion on the charts for those interested.