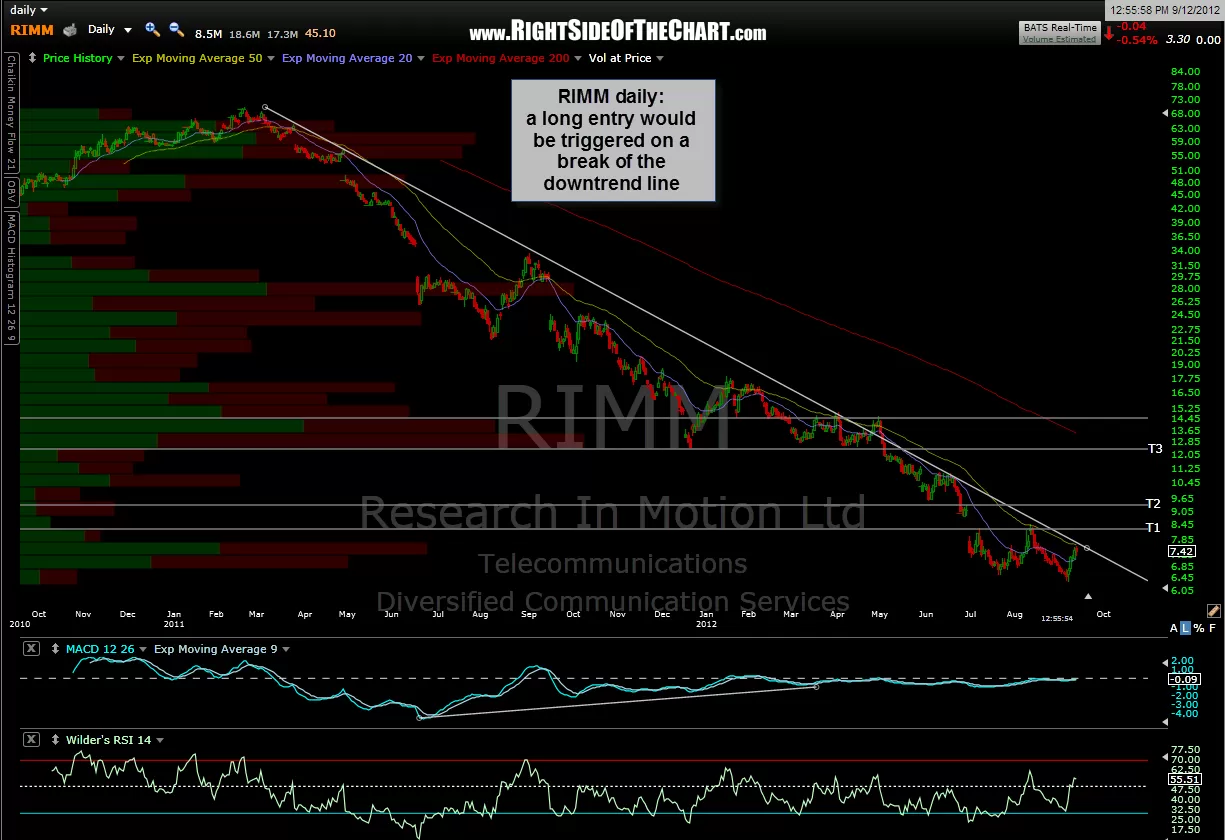
fyi- the RIMM long setup, which was added on sept 12th will most likely gap up tomorrow morning as the stock is trading up sharply in the after-hours trading session following their earnings release. i wanted to point this out for two reasons: 1) as the stock recently had two intraday breakouts above that trendline on 9/14 & 9/18, i’d imagine that some traders may have taken the breakout and 2) i wanted to discuss when to consider taking a breakout and when it might be best to pass.
let start with the two recent breakouts on 9/14 & 9/18 which failed. obviously, i prefer to see a stock that breaks above a pattern or trendline close the day above that trendline. sometimes if i jump the gun on taking a breakout that fails to do so i will close the position before the bell but more often i will allow it a little more downside (maybe 3-5%, it all depends on how far the preferred price target on the trade is). there are other times that i may decide to pass on a breakout, at least right away, if other factors such as market conditions or something specific to that stock suggests that the breakout may stick. my trading style just happens to be more flexible than some traders who take 100% of their buy and sell signals and use rigid stop criteria. however, i do my best to post most of the breakout on the setups posted here and often i will give my opinion as to whether it looks like an “all clear” entry or if the breakout looks suspect. with that being said, i chose to ignore the recent brief spikes above that downtrend line in RIMM as i was highly suspect of them sticking based on market conditions at the time.
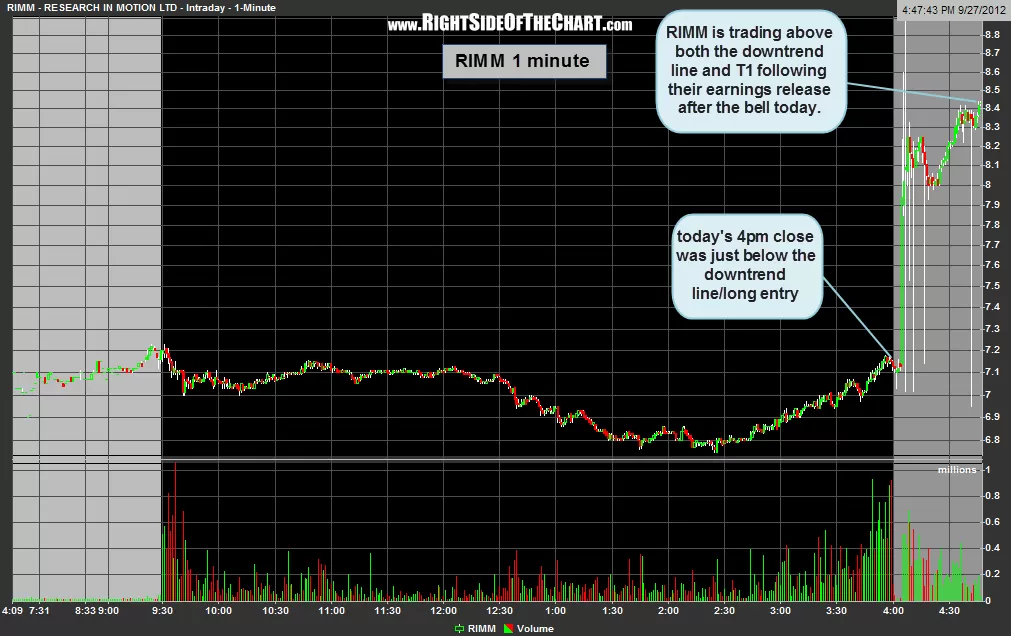
the other consideration for breakouts that must be dealt with on a less frequent basis is large gaps. again, the decision of whether to enter a new trade for a setup that has made a large opening gap to break out of the pattern is highly subjective and based on a myriad of factors which are unique to each trade. one of the most important considerations isn’t so much “how much has the stock gapped up or down percentage terms” but more so “how much has the stock gapped up or down relative to the R/R ratio or expected return”. for example, as i type, RIMM is now trading at 8.72 (higher than when i made the 1 minute chart below). that puts the stock nearly 1/2 way between my first and second targets, or about a 20% gain from where it would have triggered a long entry today on a break over that trendline (7.25 area).
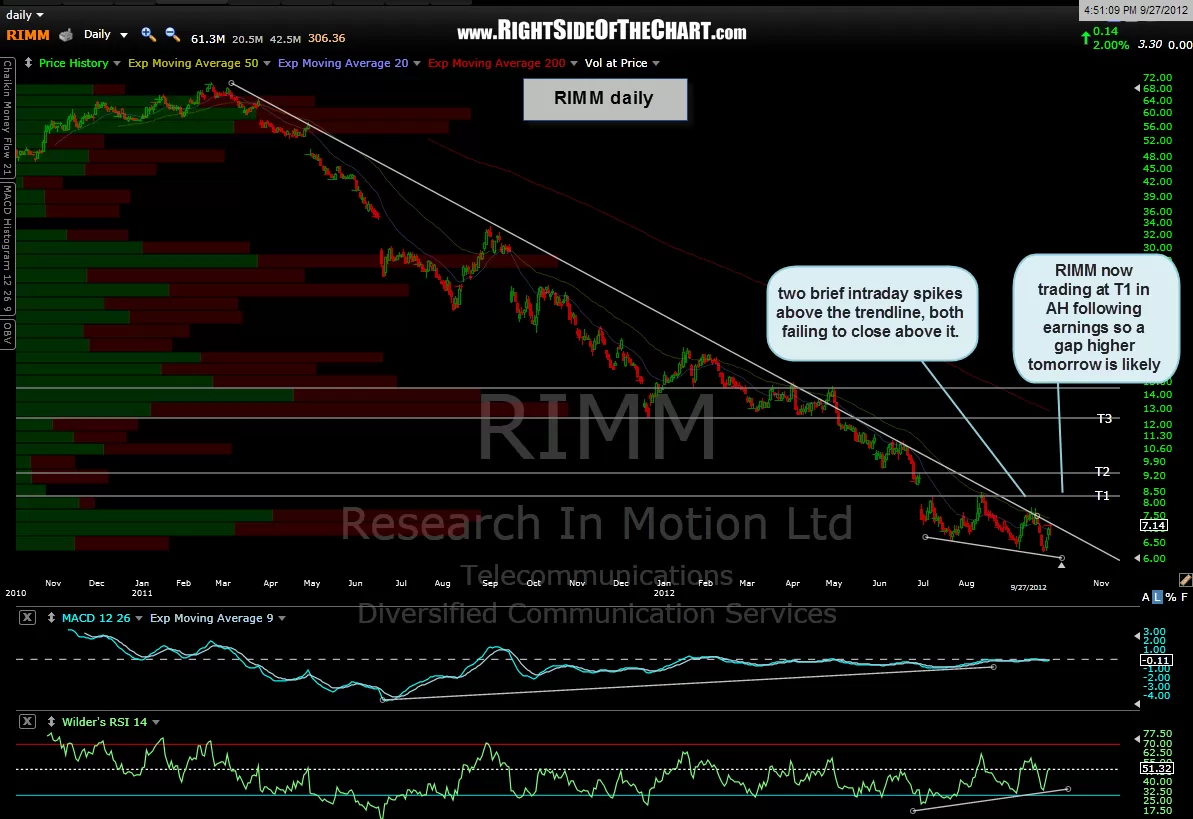
looking at this chart in a vacuum (meaning factoring out my overall bearish market bias), my preferred target on this trade would be T3, or the 12.45 level. although that level would be about a 72% gain from the preferred entry of 7.25, it now drops down to 51% on an entry at current levels (8.72). still not a bad return but we don’t trade in a vacuum and in the real world, the risk to a sudden drop in stock remains elevated right now. on top of that, if taking a RIMM breakout on a normal cross above that downtrend line, calculating an objective stop would be much easier. however, if one were to chase this breakout on a gap tomorrow (assuming the current price), then the stock would have gapped smack in the middle of that gap show to the left on the daily chart and now, anything but a very large stop (in excess of 10%) would be very likely to bit hit before the stock advanced higher to hit T3, assuming that it does.
in the case of this real-world example, i would not chase the gap higher on RIMM at current AH levels (8.72). therefore, i might remove RIMM from the trade setups list tomorrow. however, a lot can (and probably will) happen before the market opens at 9:30 ET tomorrow and if so, i will try to post my thoughts on the stock shortly before the open. one possible scenario would be for the stock to either open at, or pullback to the T1 level, which should act as support. even if that support level ends up not holding, one could still take a shot with a starter position just above that level with an objective stop not far below, thereby limiting their downside and helping to more objectively quantify their downside loss potential vs. just randomly buying the stock in the middle of “no-man’s land”, where it is currently trading. (i refer to areas without any well defined support or resistance levels above or below as “no man’s land”).
first chart is the original setup posted a couple of weeks ago, then today’s closing chart, followed by the 1 minute chart showing the big move in the AH session.