
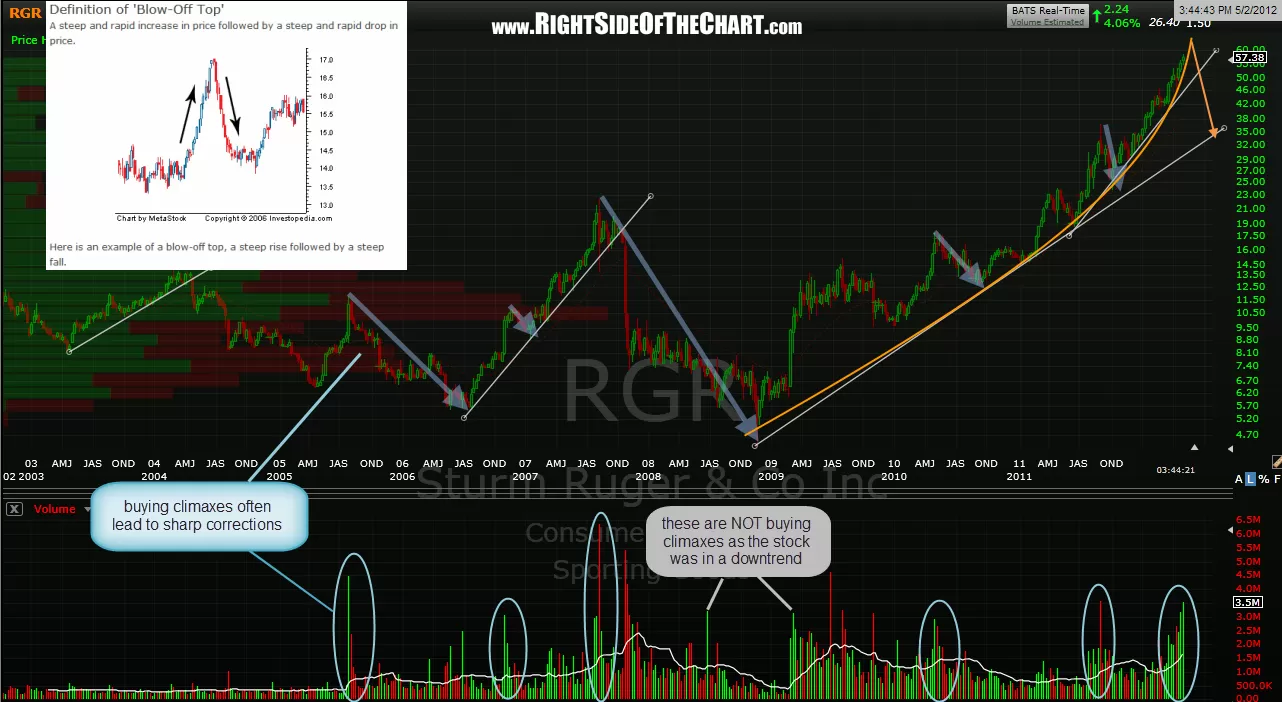
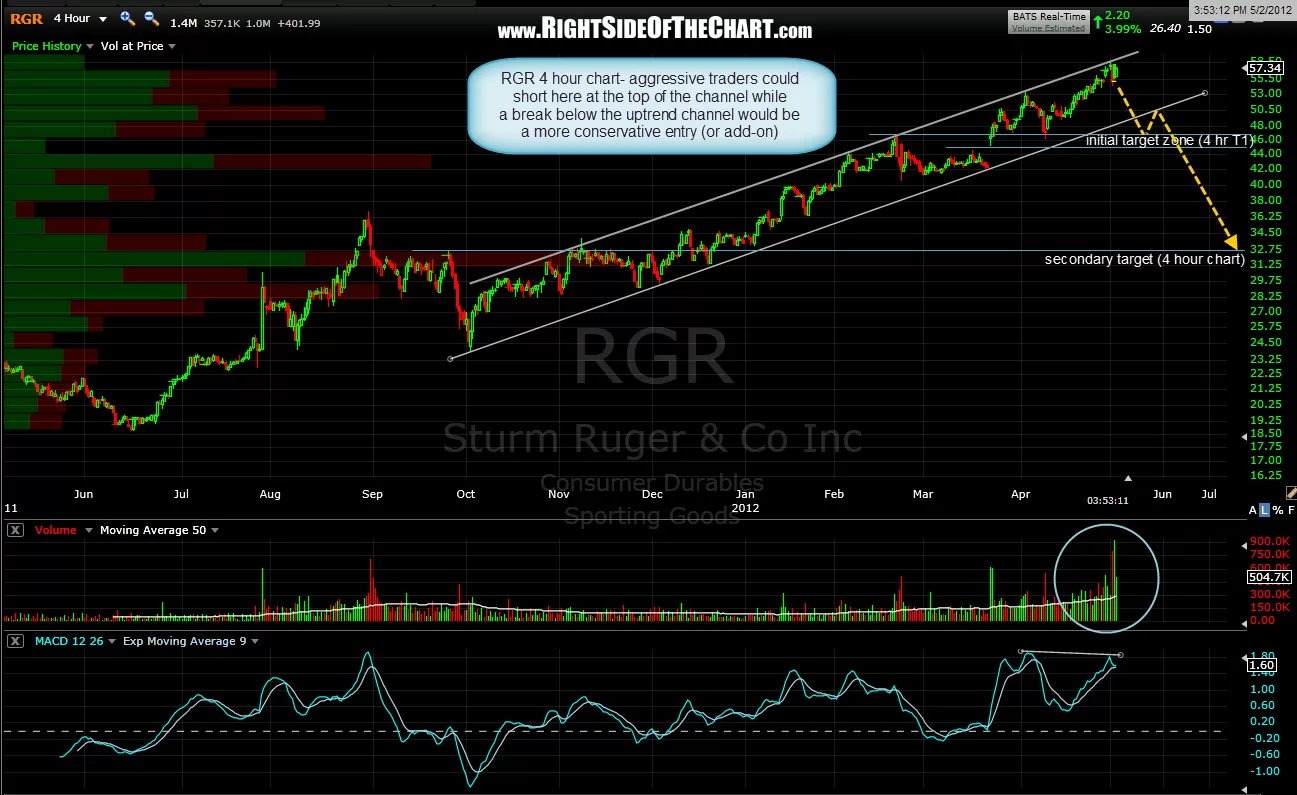
RGR might be in the final stages of putting in a blow-off top as evidenced by the current volume pattern (a potential buying climax). weekly chart shows it best while the 4 hour chart below zeros in on two possible entry points: right here at the top of the channel for a more aggressive trader or one could wait for a break below the bottom of that channel for a more solid sell signal.
let me caution anyone relatively new to trading; stocks in parabolic uptrend like this experience the sharpest gains at the top, just before prices suddenly reverse hard and fast. therefore, you can lose a lot of money by shorting a full position of a stock like this, even if you are just a few days early sometimes. as always, DYODD and unless this fits your own personal trading style and risk tolerance, consider passing on this one until a more suitable set-up comes along.
initial targets based on the 4-hour charts are marked. however, once/if this trade begins to play out, i will update some targets on the daily chart or weekly chart although currently i’m looking at those two white uptrend lines at this point.