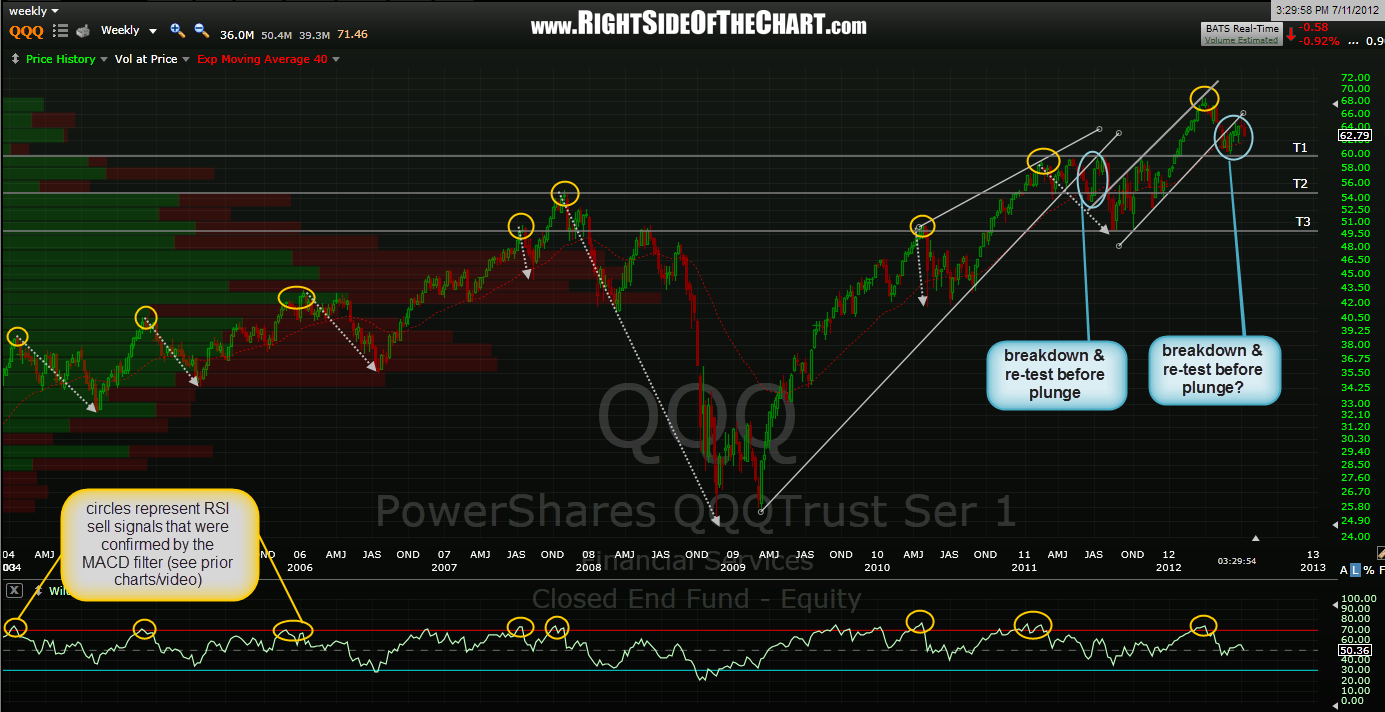
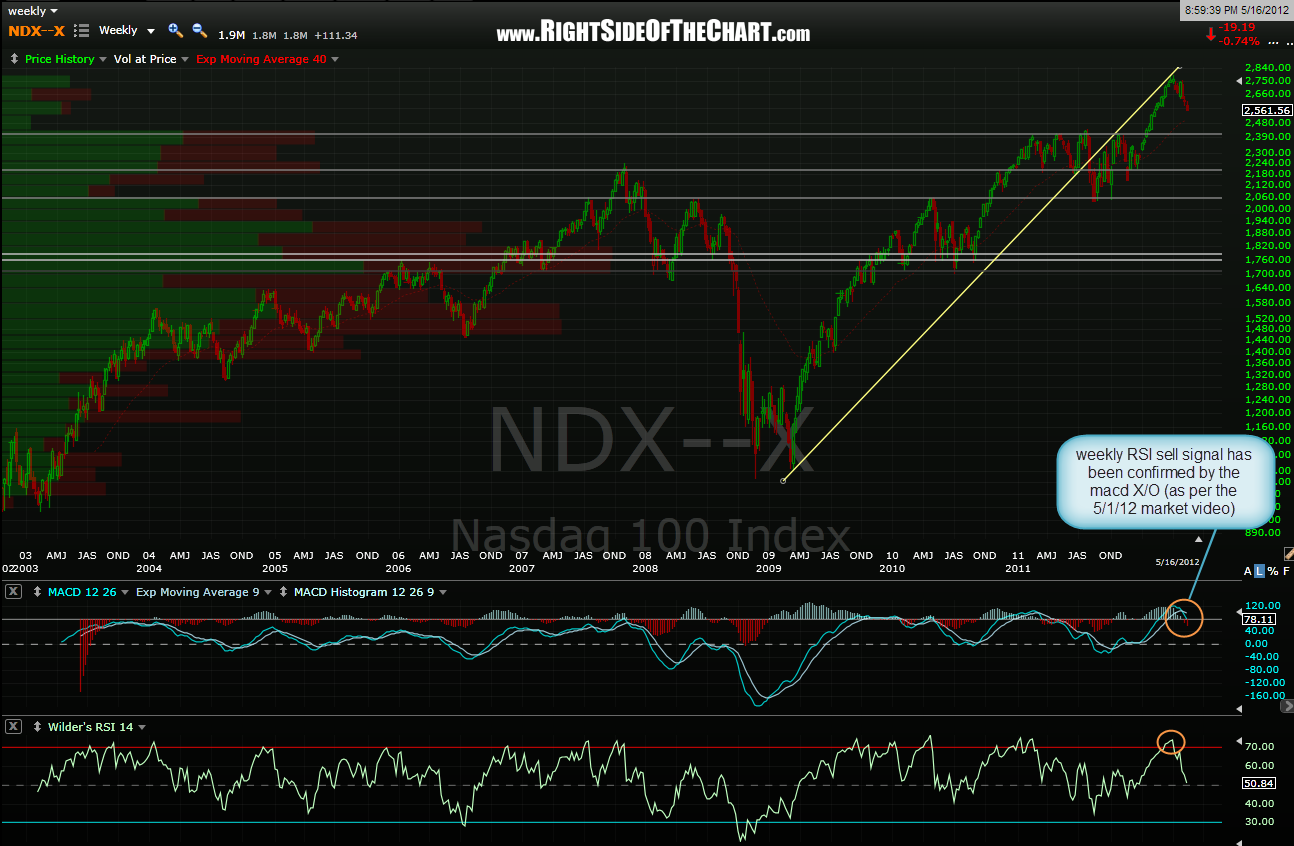
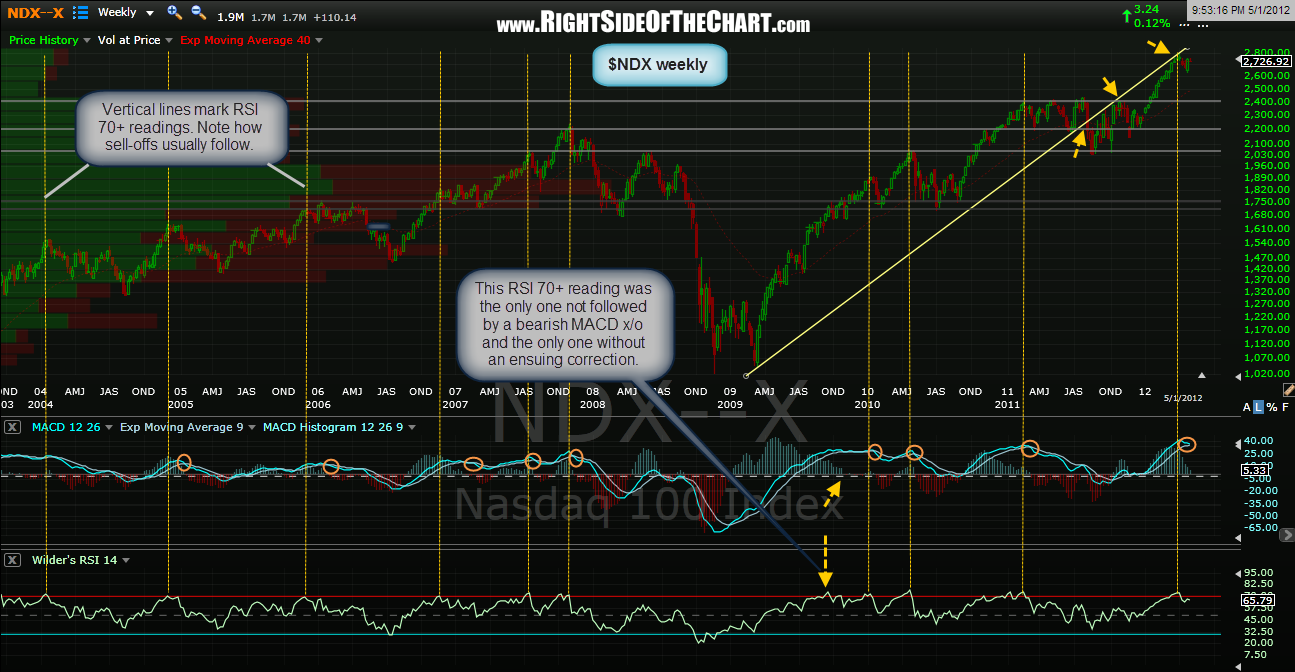
the third chart below is the updated QQQ weekly with some downside targets, should the bearish scenario play out. the first is the NDX weekly chart posted back on may 1st showing what i considered to be a very powerful sell signal at the time and the second chart is the follow-up NDX weekly from may 16th which showed the confirming MACD filter that i was expecting, which further increased the odds of that powerful sell signal playing out. those posts, along with the accompanying video, can be viewed by clicking here.
so ok, now what? well, my thoughts remain the same now as they did back then: late march/early april most likely marked the beginning of a steep decline in the market and although we did get a substantial correction from that point down into the june 4th lows, i believe that that was likely only the initial leg down and the bounce since then has been corrective in nature. the fact that most major indices put in negative divergences across several key indicator/oscillators (and pretty much those that didn’t, such as the small caps, only failed to put in divergences since the failed to make a new high…even more bearish). finally, consider the fact that we were over 3 years and anywhere from 105% to well over 150% higher (depending on which index) since the last fed induced bull market started in march ’09. the average duration of bull markets historically been 155 weeks, or just shy of 3 years and that average actually drops down to 134 weeks in secular bear markets, such as the one that we have been in since 2000.
does all this mean that we can load the boat short and walk-away from the computer? no. for me this simply tells me to continue interpreting the charts with an overall bearish bias due to the likelihood that the primary trend remains lower. in other words, i can almost always make a bang-up case for being long or short at just about any point in time. stock charts are like those Rorschach tests, where different people looking at the same inkblots will see completely different things. therefore, if one’s overall bias is bullish, they will tend to see bullish patterns and unconsciously (or due to lack of competency), not recognize the abundant opportunities that present themselves in a bear market or even a simple correction.
first things first of course and that would be to wait for the next confirmed sell signal and that would come on a break of the uptrend line that i highlighted on the 4 hour SPY chart in the previous post, as well as this virtually identical trendline in this 4 hour QQQ chart. once/if that happens, it will further strengthen the bearish case and increase the odds of some of those lower targets being hit. that would also prompt me to further move away from a hit-n-run mode back to a swing trading mode with longer holding periods, wider stops, larger price targets and increase position sizes.