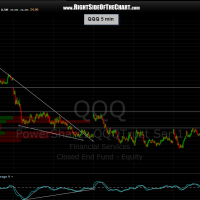
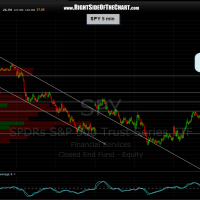
5 minute charts of the QQQ & SPY. the SPY was able to gap up just above S3 and into that thin zone (as indicated by the vol at price histogram) which runs all the way to that uppermost line that i had drawn (i don’t have an “R4” stamp so it wasn’t labeled). however, prices are now just shy of that uppermost resistance level on the SPY while the Q’s are just barely above S1, and at the bottom of it’s comparable thin zone.
today has all the makings for a trend day, where prices continue to move higher throughout the day and close near the highs however, for the last month now we have seen the market close near it lows more often than not so i am more apt to add shorts at these resistance levels to fade this rally than to cover or chase longs. i think a short of the indexes here with a very tight stop over this level (1% or so) offers a good R/R for an active trader looking for a quick trade or maybe a swing trader looking to add short exposure. one could also look for existing short trades that have bounced back to resistances levels. for those preferring longs, the recently triggered ACI & INTC longs are two of my favorites and FSLR may be starting to break out of a triangle pattern here (chart soon). finally: when in doubt, sit it out. there’s no better place to be than on the sidelines if you are unsure what to do.


