
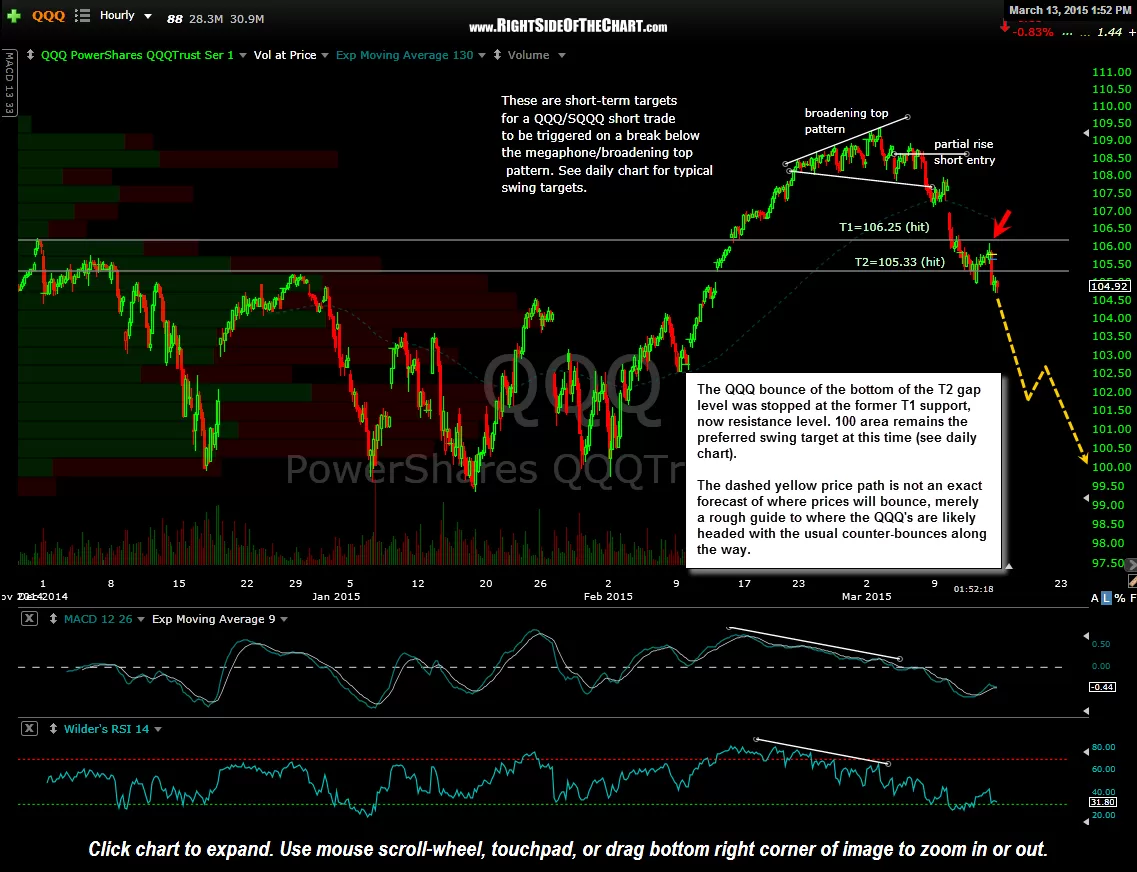
The QQQ bounce off the bottom of the T2 gap level was stopped at the former T1 support, now resistance level (as once broken, support becomes resistance). The 100 area remains the preferred swing target at this time (see daily chart). The dashed yellow price path on this 60 minute chart is not an exact forecast of where & when prices will bounce, merely a rough guide to where the QQQ’s are likely headed with the usual counter-bounces along the way.
-
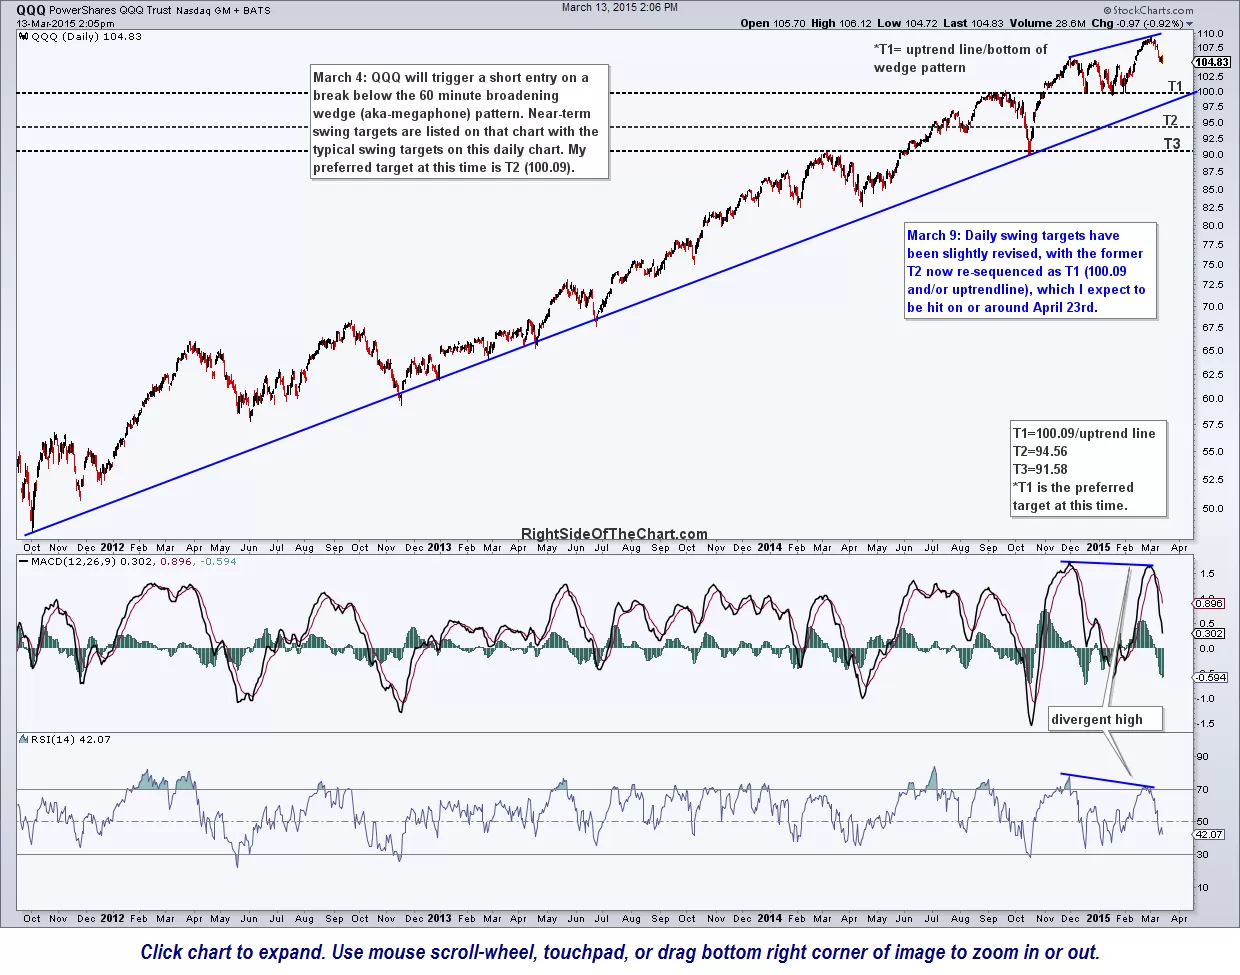
- QQQ daily March 13th
-
- QQQ 60 minute March 13th
Now that we’ve already experienced the expected reaction off the 60 minute final target (or at least I believe that to be the case), we are likely to see the selling in the broad markets begin to accelerate next week, possibly kicking off with a gap down on Monday. Again, just my best guess so as always, DYODD and trade according to your own unique trading plan, including stops & profit targets.
click here to view the live, annotated daily chart of QQQ