 even the most optimistic bull will concede that the market is due for at least a minor pullback or consolidation soon, in order to alleviate the overbought conditions. the million dollar question for traders is whether or not the recent breakouts to new high in the US markets was the real-deal or if they will prove to be bull-traps, followed by a sharp downside move. as we all have our opinions, only time will tell.
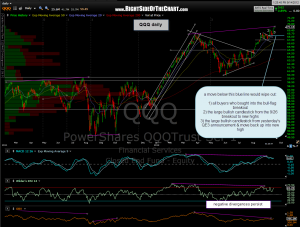
as my primary focus lately has been on the (former, but not current) leading index, the $NDX/QQQ, i have noted a level which could prove to be a significant support level if tested. in just the last 7 trading sessions, the Q’s have witnessed the breakout of a text-book bull-flag, which lead to a very impulsive breakout to new multi-year highs (9/6 candlestick), followed by a couple of days of consolidation & retest of that bull-flag breakout level and then yet another large, impulsive move higher immediately following yesterday’s fed pledge of more QE. all in all, about as bullish as price action can get, technically speaking.
therefore, a key level to watch next week would be the 68.30 level (blue line on this daily chart), followed by the 67.40 level (horizontal support & the bottom of that recent bull-flag) should the 68.30 go. any successful back-test of those levels, with a subsequent move to new highs would be bullish while a break below would be very bearish IMO and likely open the door to a significant sell-off.

