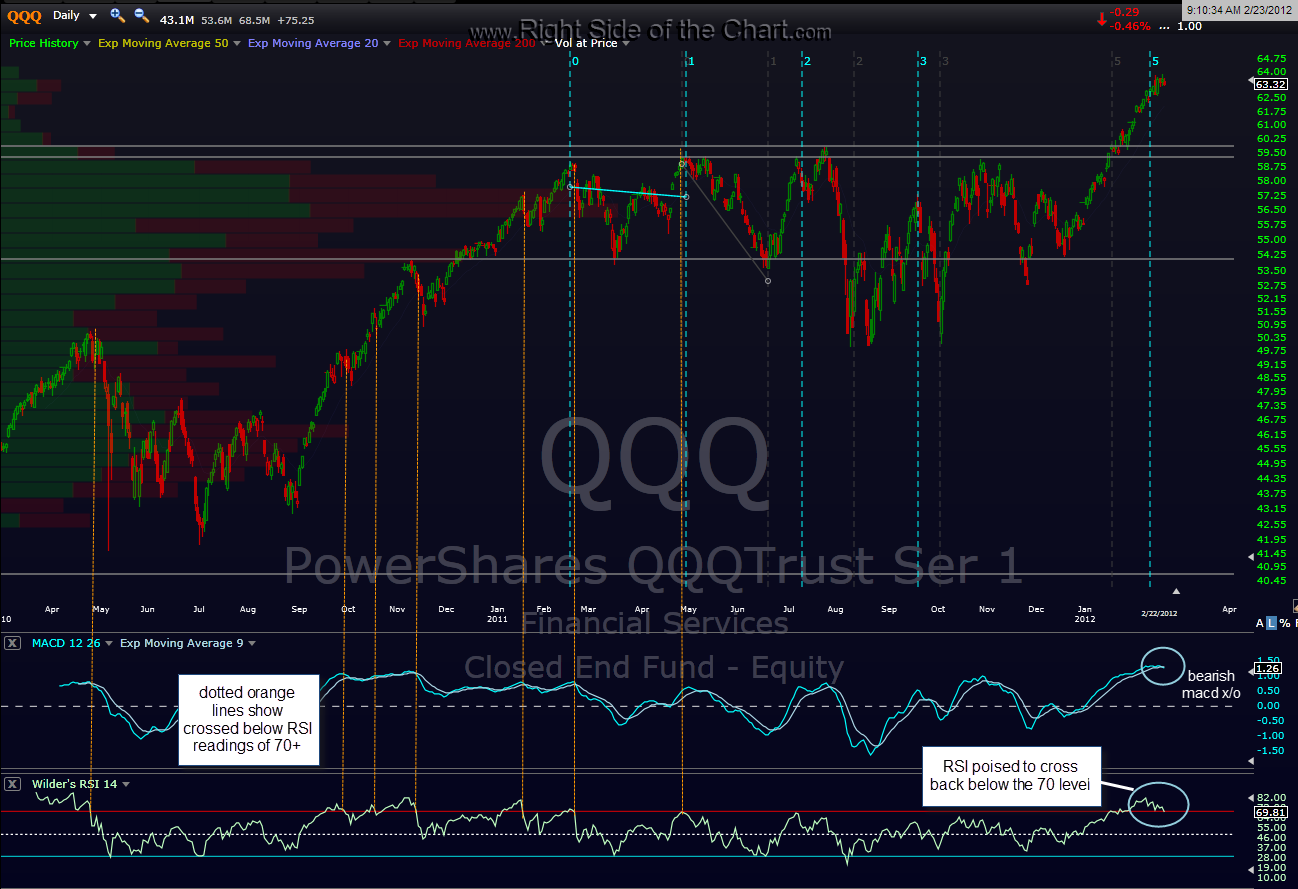
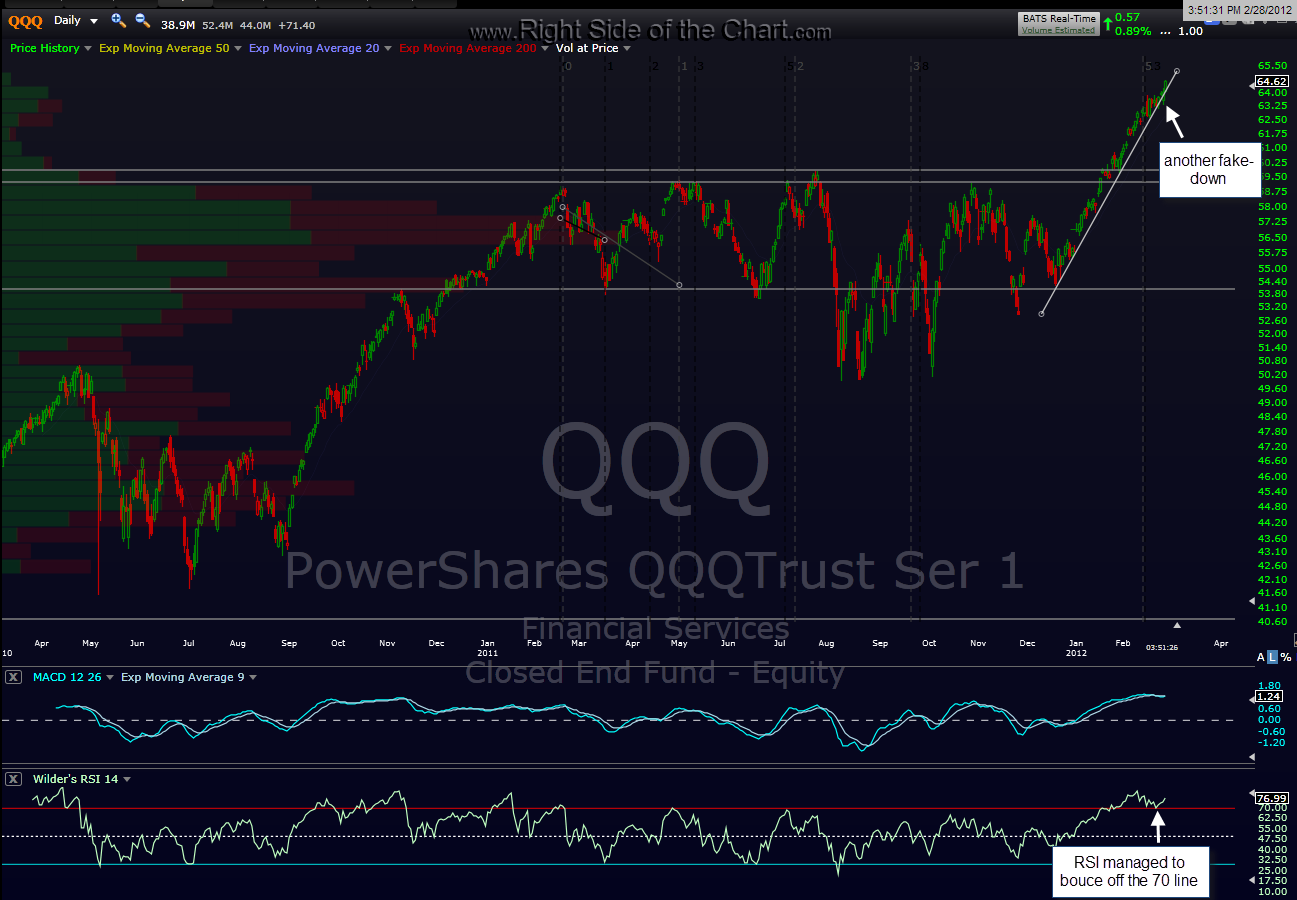
just an update to the QQQ daily chart posted on feb 23rd where i mentioned that a break below the RSI 70 might be considered a sell signal. well although it looked very likely that would happen, the Q’s managed to recoup all their early morning losses that day and close positive, thus bouncing off the RSI 70 level. the gap down that day also managed to give another false sell signal for the index by breaking below the steep daily uptrend line but then closing back above the line (an official sell signal on a daily trendline break required a daily close, not just an intraday breach).
although the trend has been strong, it is obviously waning and the red flags that started appearing a few weeks ago have only become more numerous and glaring. continue to be selective with both long and short entries and consider trailing or ratcheting up stops on winning positions that are holding out for additional gains on. among my most historically reliable trend change indicators, the $NAAD (nasdaq adv/declining issues) continues to remain on the sell signal that i posted recently yet the COMPQ and NDX continue to make new highs today and yet again today, the nasdaq had more declining than advancing issues. declining breadth (fewer and fewer big stocks carrying the entire market) is something usually seen leading into a significant top. a couple of things to keep in mind on that $NAAD buy/sell signal system that i use: 1) no signal indicator works all the time and 2) that is not an exact timing indicator. it is a trend reversal indicator and many of the past market inflection points came days and sometimes weeks after the signal was given.